Assessment Summary
0 of 233 Questions completed
Questions:
Information

You have already completed the assessment before. Hence you can not start it again.
Assessment is loading…
You must sign in or sign up to start the assessment.
You must first complete the following:
Results
Results
0 of 233 Questions answered correctly
Your time:
Time has elapsed
You have reached 0 of 0 point(s), (0)
Earned Point(s): 0 of 0, (0)
0 Essay(s) Pending (Possible Point(s): 0)
Categories
- Not categorized 0%


- 1
- 2
- 3
- 4
- 5
- 6
- 7
- 8
- 9
- 10
- 11
- 12
- 13
- 14
- 15
- 16
- 17
- 18
- 19
- 20
- 21
- 22
- 23
- 24
- 25
- 26
- 27
- 28
- 29
- 30
- 31
- 32
- 33
- 34
- 35
- 36
- 37
- 38
- 39
- 40
- 41
- 42
- 43
- 44
- 45
- 46
- 47
- 48
- 49
- 50
- 51
- 52
- 53
- 54
- 55
- 56
- 57
- 58
- 59
- 60
- 61
- 62
- 63
- 64
- 65
- 66
- 67
- 68
- 69
- 70
- 71
- 72
- 73
- 74
- 75
- 76
- 77
- 78
- 79
- 80
- 81
- 82
- 83
- 84
- 85
- 86
- 87
- 88
- 89
- 90
- 91
- 92
- 93
- 94
- 95
- 96
- 97
- 98
- 99
- 100
- 101
- 102
- 103
- 104
- 105
- 106
- 107
- 108
- 109
- 110
- 111
- 112
- 113
- 114
- 115
- 116
- 117
- 118
- 119
- 120
- 121
- 122
- 123
- 124
- 125
- 126
- 127
- 128
- 129
- 130
- 131
- 132
- 133
- 134
- 135
- 136
- 137
- 138
- 139
- 140
- 141
- 142
- 143
- 144
- 145
- 146
- 147
- 148
- 149
- 150
- 151
- 152
- 153
- 154
- 155
- 156
- 157
- 158
- 159
- 160
- 161
- 162
- 163
- 164
- 165
- 166
- 167
- 168
- 169
- 170
- 171
- 172
- 173
- 174
- 175
- 176
- 177
- 178
- 179
- 180
- 181
- 182
- 183
- 184
- 185
- 186
- 187
- 188
- 189
- 190
- 191
- 192
- 193
- 194
- 195
- 196
- 197
- 198
- 199
- 200
- 201
- 202
- 203
- 204
- 205
- 206
- 207
- 208
- 209
- 210
- 211
- 212
- 213
- 214
- 215
- 216
- 217
- 218
- 219
- 220
- 221
- 222
- 223
- 224
- 225
- 226
- 227
- 228
- 229
- 230
- 231
- 232
- 233
- Current
- Review
- Answered
- Correct
- Incorrect
-
Question 1 of 233
1. Question
1. You are working with a project management application that is fully hosted within Microsoft Teams. The application was built using Microsoft Power Apps.
You need to create a Power BI report that retrieves data directly from this application. Which Power BI connector should you use?
CorrectIncorrect -
Question 2 of 233
2. Question
2. A sales report has already been published in Power BI. The report uses imported data from an Excel file stored in a SharePoint folder, and the model includes multiple existing measures.
You need to build a new Power BI report using the same data and measures, while keeping the work required to a minimum. Which data source should you connect to?
CorrectIncorrect -
Question 3 of 233
3. Question
3. You loaded two Excel tables into Power Query: Customer and Address.
Customer includes:
Customer ID
Customer Name
Phone
Email Address
Address IDAddress includes:
Address ID
Address Line 1
Address Line 2
City
State/Region
Country
Postal CodeEach Customer ID is unique in the Customer table, and each Address ID is unique in the Address table.
You need to produce a single query with one record per customer, and each record must include the customer’s City, State/Region, and Country. What should you do?
CorrectIncorrect -
Question 4 of 233
4. Question
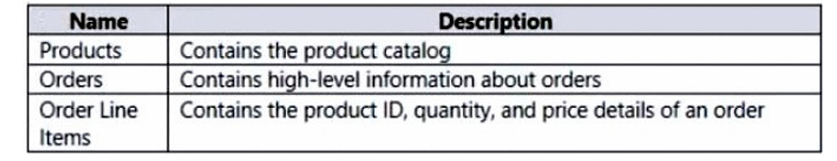
4. You are developing a Power BI report using data from an Azure SQL database called erp1.
You load the following tables into the model:
Products (product catalog details)
Orders (order-level summary information)
Order Line Items (product ID, quantity, and pricing details per order)You need the report to support these analyses:
Trend reporting of orders over time, including a measure for total order amount
Analysis of orders by product characteristicsTo ensure the report visuals respond as quickly as possible, you want to reduce the work done at query time.
What should you do first?
 CorrectIncorrect
 -
Question 5 of 233
5. Question
5. A SharePoint Online site contains multiple document libraries. One of these libraries stores manufacturing reports as Excel workbooks, and every report follows the same table/layout structure.
In Power BI Desktop, you want to load only those manufacturing report files into a single table for analysis.
What should you do?
CorrectIncorrect -
Question 6 of 233
6. Question
6. You are working with a CSV file that stores customer complaints. One of the columns, Logged, records the date and time when each complaint was submitted.
The values in the Logged column follow this format:
2018-12-31 at 08:59You want to analyze complaints by date in Power BI and take advantage of the built-in date hierarchy.
What should you do?
CorrectIncorrect -
Question 7 of 233
7. Question
7. An Excel workbook is stored in a OneDrive folder. You need to load the workbook into a Power BI dataset.
The dataset must be able to support scheduled refresh in the Power BI service (powerbi.com).
Which two connectors can you use to connect to the file?
(Select two. Each correct option is a complete solution.)CorrectIncorrect -
Question 8 of 233
8. Question
8. An Azure SQL database stores sales transaction records and is updated on a continuous basis.
You need to build reports that can identify potential fraud, and the reports must reflect new or changed data within five minutes of it being written to the database.
How should you configure the Power BI data connection?
CorrectIncorrect -
Question 9 of 233
9. Question
9. A BI developer has built a Power BI dataflow that connects to tables in an on-premises SQL Server using DirectQuery. The Enhanced Dataflows Compute Engine is enabled.
You need to use this dataflow in a Power BI report, and the solution must:
Reduce reliance on online query processing
Provide fast calculations and quick visual rendering
Include only records from the current year, up to and including yesterdayWhat should you do?
CorrectIncorrect -
Question 10 of 233
10. Question
10. You are trying to connect Power BI Desktop to a Cassandra database. When reviewing the available Get Data connectors, you notice that there is no dedicated Cassandra connector.
You need to choose an alternative connector that will allow Power BI to connect to the database.
Which connector should you use?
CorrectIncorrect -
Question 11 of 233
11. Question
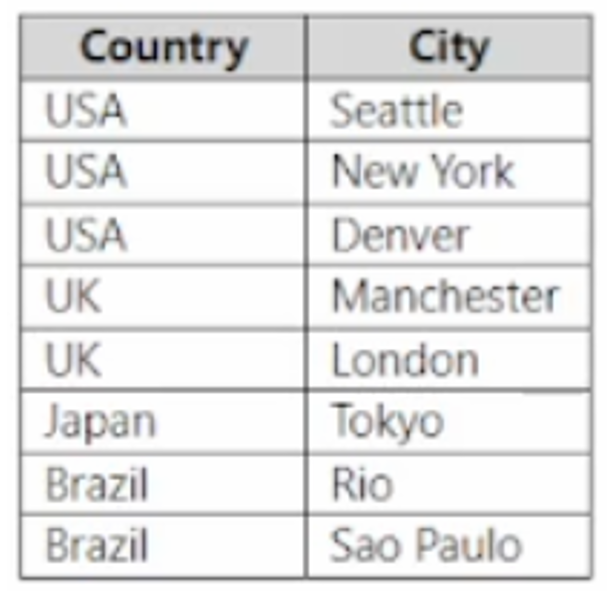
11. You are preparing a Country dimension table for use in a star schema.
The source data includes two columns: Country and City, with multiple cities listed under the same country.Your goal is to create a dimension table that contains only one row per country, with no duplicate country values.
Which two actions should you take to achieve this result?
Select two answers. Each correct answer represents part of the solution.
 CorrectIncorrect
 -
Question 12 of 233
12. Question
12. While running a query in Power Query Editor, you encounter the following error message:
Datasource.Error: Could not find file
Which two scenarios could cause this error to occur? Select two answers. Each correct option represents a valid cause.
CorrectIncorrect -
Question 13 of 233
13. Question
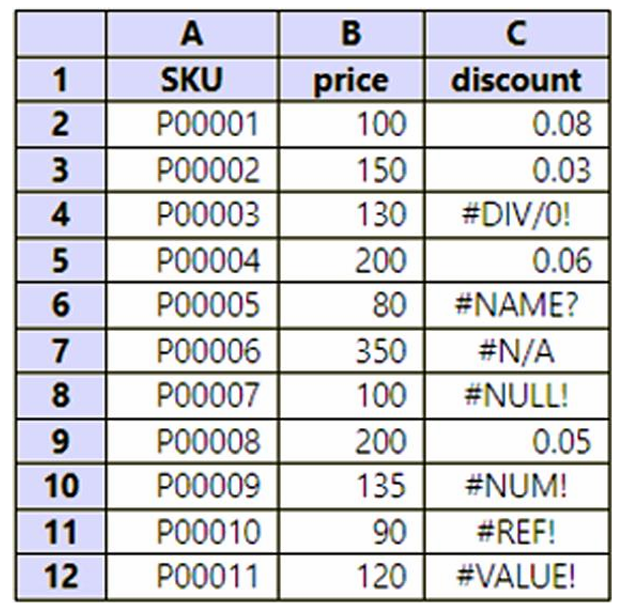
13. An Excel worksheet contains product data with the columns SKU, price, and discount.
Several rows in the discount column display error values (for example, calculation or reference errors).You need to clean the data using Power Query Editor so that:
Any error in the discount column is replaced with a value of 0.05
No rows are removed from the dataset
The solution requires minimal maintenance and configurationWhat should you do in Power Query Editor?
 CorrectIncorrect
 -
Question 14 of 233
14. Question
14. You’re working with a CSV that logs customer complaints. One column, Logged, stores both the date and time of each complaint in this format:
2018-12-31 at 08:59
You want to report on complaints by date and use Power BI’s built-in date hierarchy.
What should you do?
CorrectIncorrect -
Question 15 of 233
15. Question
15. You load two tables from an Azure SQL database into Power Query: Order Header and Order Details. The two tables are related through a shared column called Order ID.
You want to create one query that combines both tables so that it includes the distinct columns from each table.
Which option should you choose in Power Query Editor?
CorrectIncorrect -
Question 16 of 233
16. Question
16. A Power BI Desktop (PBIX) file imports data from an Excel workbook located on a local network file share. You are informed that the Excel file has been moved to a different folder or location.
You need to update the PBIX file so that it connects to the new file location.
Which three actions can you use to update the connection successfully? Select three answers. Each correct answer represents a complete solution.
CorrectIncorrect -
Question 17 of 233
17. Question
17. Northwind Traders is a specialty food importer that has recently adopted Power BI to improve reporting and analytics.
Currently, the sales team depends on the IT department to create reports using SQL Server Reporting Services (SSRS). This process is slow and often results in reports that do not fully meet business needs.
Existing Environment
Data is sourced from:
An Azure SQL Database containing sales, product, supplier, category, order, and employee data
A daily-exported Excel file stored in SharePoint Online
Historical data must be retained for the current year and the previous three yearsReporting Requirements
The organization needs the following reports:
Top Customers
Top Products
On-Time ShippingThese reports must support filtering by time period, sales region, and product category, and must provide fast interaction performance for users.
Technical and Security Requirements
A single dataset must support all reports
All reports must be hosted in one Power BI workspace
Data must be refreshed daily and be current by 7:00 AM Pacific Time
The data model should be as small as possible while still meeting reporting needs
Row-level security (RLS) must be applied to restrict sales users to their assigned regionsAccess is controlled using Azure AD security groups
Question
You need to design the semantic model for this solution.
Which storage mode should you use for the tables in the semantic model?CorrectIncorrect -
Question 18 of 233
18. Question
18. You want to build a bug tracking dashboard in Power BI Desktop using data from Azure DevOps Analytics.
You need to set up a connector that can:
Authenticate to Azure DevOps
Work with Analytics views
Apply filtering at the source (in the cloud)Which connector should you choose?
CorrectIncorrect -
Question 19 of 233
19. Question
19. Note: This question belongs to a scenario-based question set. Each question proposes a different solution approach. Some questions may have more than one valid solution, while others may not.
Once you submit your answer, you cannot return to this question.You are working with a DirectQuery Power BI semantic model connected to a data source that includes a case-sensitive column.
After connecting to the model, you notice that the column contains errors and undefined values.
You consider addressing the issue by implicitly converting the column values to the required data type.
Does this approach resolve the problem?
CorrectIncorrect -
Question 20 of 233
20. Question
20. Note: This item is part of a multi-question scenario. Each question proposes a different fix for the same situation. After you submit your response, you won’t be able to revisit this question.
You have a DirectQuery Power BI semantic model connected to a data source that includes a case-sensitive column.
After connecting, you notice the model contains errors and unrecognized/undefined values.
Proposed solution: Switch the semantic model to a different mode (change the model mode).
Does this solution resolve the issue?
CorrectIncorrect -
Question 21 of 233
21. Question
21. Note: This question is part of a scenario-based series. Each item suggests a different possible fix. Once you answer, you can’t return to it.
A data source includes a column where values are case-sensitive (uppercase/lowercase differences matter).
Your Power BI semantic model uses DirectQuery.After connecting, you notice the model shows errors and unrecognized/undefined values.
Proposed solution: Standardize the text casing (for example, convert everything to upper or lower case) in the source query or in Power Query Editor.
Does this solution achieve the goal?
CorrectIncorrect -
Question 22 of 233
22. Question
22. Note: This question is part of a multi-question scenario. Each question proposes a different potential fix. Once you submit your answer, you cannot return to this question.
You are working with a Power BI semantic model that uses DirectQuery.
The underlying data source includes a column with case-sensitive values.After connecting to the model, you notice errors and undefined values in the data.
Proposed solution: Add an index column and standardize the text casing (for example, convert all values to upper or lower case) in the data source.
Does this solution resolve the issue?
CorrectIncorrect -
Question 23 of 233
23. Question
23. An Excel workbook is stored in a OneDrive location. You need to load this file into a Power BI semantic model.
The semantic model must support scheduled refresh in the Power BI service (powerbi.com).
Which two data connectors can you use to connect to the file and meet this requirement?
Select two answers. Each correct option represents a complete solution.
CorrectIncorrect -
Question 24 of 233
24. Question
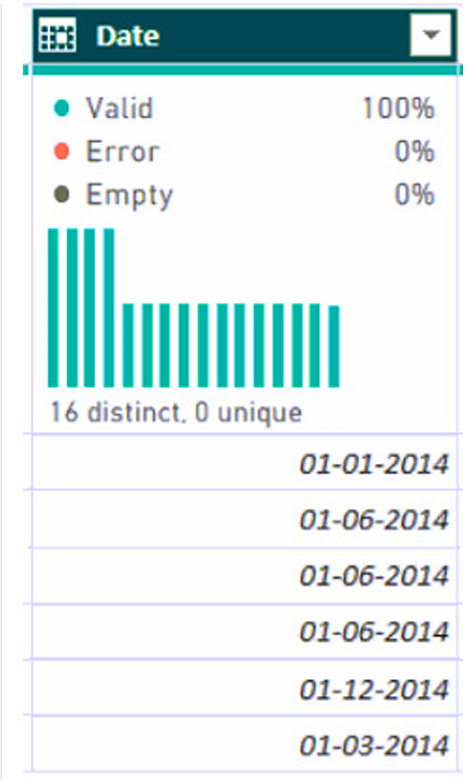
24. While reviewing data in Power Query Editor, you examine a column named Date that contains full date values (day, month, and year), as shown in the preview.
You want to modify this column so that it contains only the year value.
The solution should require the least possible configuration and maintenance.What should you do?
 CorrectIncorrect
 -
Question 25 of 233
25. Question
25. In Power BI Desktop, you import two tables: Customer and Contacts.
Customer includes:
Customer_Name
Customer ID
WebsiteContacts includes:
Contact ID
Contact Email
Contact Name
Customer NameThe Contacts table is populated through an online contact form, and the entries may contain inconsistencies (for example, spelling differences, extra spaces, or variations in formatting) because the input data is not cleaned.
You need to merge the Customer and Contacts tables.
What should you do?
CorrectIncorrect -
Question 26 of 233
26. Question
26. You have a Power BI Desktop report named Report1 that connects to an Azure SQL Database.
Another user, User1, wants to create their own Power BI report using the same data source. You want to make it easier for User1 to connect to that data source without recreating the connection details manually.
Which type of file should you create to simplify the data source connection?
CorrectIncorrect -
Question 27 of 233
27. Question
27. You are building a Power BI semantic model (Model1) that connects to an Azure SQL database (DB1).
The semantic model must reflect data changes within two minutes after updates occur in the database.Which connectivity mode should you use?
CorrectIncorrect -
Question 28 of 233
28. Question
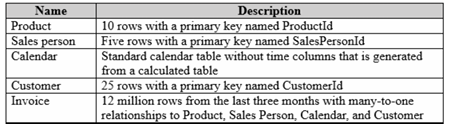
28. A Power BI report contains a very large Invoice table (12 million rows from the last three months) and several small dimension tables (Product, Sales Person, Calendar, Customer).
For the past three days, dataset refresh has failed with this error:
“You have reached the maximum allowable memory allocation for your tier.”You must:
Fix the refresh failure caused by memory limits
Keep query response times fast for report usersWhat is the best solution?
 CorrectIncorrect
 -
Question 29 of 233
29. Question
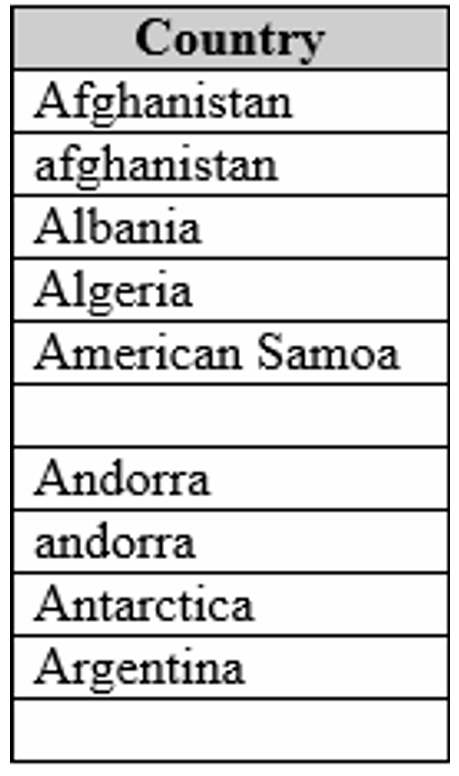
29. You have a table called DIMCountries that includes a column named Country, as shown in the exhibit.
Some country names appear more than once because they use different letter casing (for example, uppercase and lowercase).You plan to use DIMCountries as a dimension table in a Power BI report.
To ensure that the Country column contains only one unique entry per country, which two actions should you apply to the Country column?
Select two.
 CorrectIncorrect
 -
Question 30 of 233
30. Question
30. You are building a report in Power BI Desktop and have loaded a dataset that contains a free-text column called col1.
You want to analyze how often different text lengths occur in col1 (for example, how many values have 5 characters, 10 characters, and so on).
The solution must not increase the size of the data model.What should you do?
CorrectIncorrect -
Question 31 of 233
31. Question
31. You manage several Power BI reports used by the HR department.
The datasets behind these reports use row-level security (RLS) to restrict data by sales region.Each sales region has an HR manager, and you must ensure that:
HR managers can view and interact only with data from their own region
HR managers cannot modify report layouts (for example, edit visuals or structure)What is the best way to provide access to the reports for the HR managers?
CorrectIncorrect -
Question 32 of 233
32. Question
32. You need to give a user permission to add other users to a Power BI workspace.
At the same time, you must follow the principle of least privilege, meaning the user should receive only the minimum permissions required to perform this task.Which workspace role should you assign?
CorrectIncorrect -
Question 33 of 233
33. Question
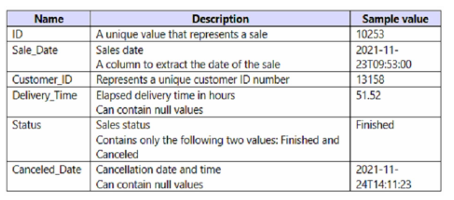
33. You have a Power BI query named Sales that loads several columns, including dates and status fields.
Key details:
Users only analyze completed (Finished) sales
Users only need the date portion of the sales date (not the time)
You want to reduce query load times
The solution must not change the analytical resultsWhich two actions should you take to meet these requirements?
Select two.
 CorrectIncorrect
 -
Question 34 of 233
34. Question
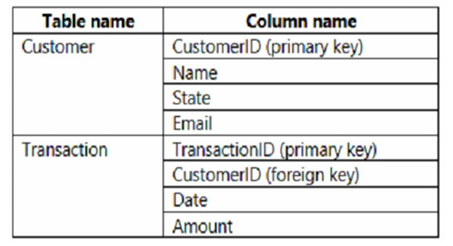
34. You are creating a Power BI report to analyze customer transactions.
The source database includes two tables:Customer – contains one record per customer
Transaction – contains multiple records per customer, representing individual transactionsYou import both tables into Power BI.
Which relationship type and direction should you configure between the two tables?
 CorrectIncorrect
 -
Question 35 of 233
35. Question
35. You are using a custom connector that retrieves email metadata for the past year, including the following fields:
ID
From
To
Subject
Body
Has AttachmentsThe dataset contains more than 10 million records.
You create a Power BI report to analyze email communication patterns between employees (who emails whom).You must ensure that:
Report users cannot read the email contents
The size of the data model is kept as small as possibleWhat should you do?
CorrectIncorrect -
Question 36 of 233
36. Question
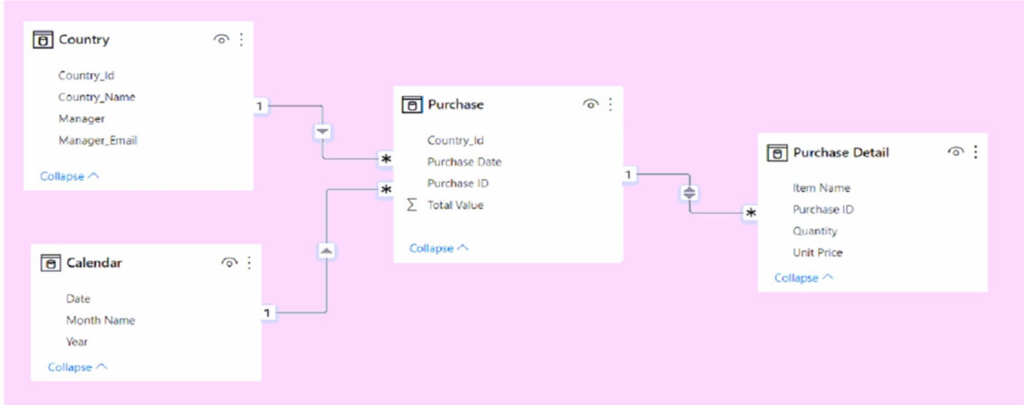
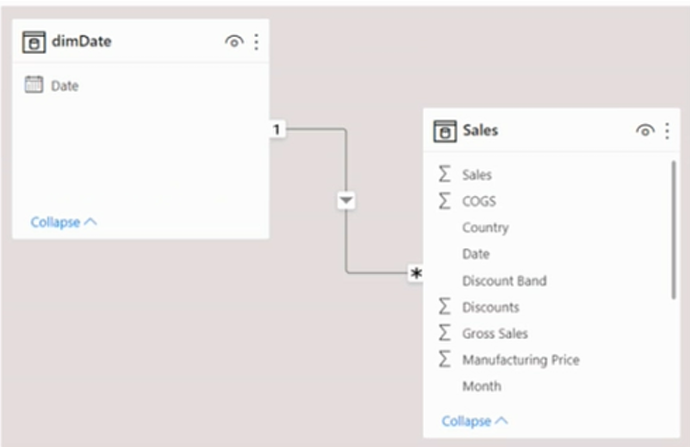
36. You have a Power BI semantic model like the one shown in the diagram.
Each manager is responsible for exactly one country.You need to implement row-level security (RLS) with the following goals:
Managers can view only the data for their own country
The solution should use the fewest possible RLS rolesWhich two actions should you take to meet these requirements?
Select two.
 CorrectIncorrect
 -
Question 37 of 233
37. Question
37. You have a Power BI report with a PBIX size of 550 MB, published to an App workspace in shared capacity (powerbi.com).
The report uses an Import dataset with a single fact table containing 12 million rows, refreshed twice daily (8:00 AM and 5:00 PM).The report has one page that includes:
15 AppSource custom visuals
10 built-in visualsUsers report that the page is slow to load and feels laggy when interacting with visuals.
What is the best recommendation to improve report performance?
CorrectIncorrect -
Question 38 of 233
38. Question
38. A Power BI data model includes three tables: Orders, Date, and City.
There is a one-to-many relationship from Date → Orders and from City → Orders.The model has two RLS roles:
Role1 applies this filter:
City[State Province] = “Kentucky”Role2 applies this filter:
Date[Calendar Year] = 2020If a user is assigned to both Role1 and Role2, what data will the user be able to see in a report?
CorrectIncorrect -
Question 39 of 233
39. Question
39. This question is part of a scenario-based series. Each question proposes a different solution that may or may not meet the stated objective.
You are building a Power BI data model that includes a very large SQL Server table named Order containing over 100 million rows.
During development, you only want to work with a small sample of the data from the Order table.
Proposed solution:
You import the entire table into Power Query Editor and then apply a filter step to limit the rows.Does this solution meet the goal?
CorrectIncorrect -
Question 40 of 233
40. Question
40. This question is part of a scenario-based series. Each question proposes a different solution that may or may not achieve the stated objective.
You are developing a Power BI data model that includes a very large SQL Server table named Order with more than 100 million rows.
During development, you want to import only a sample of the data from the Order table to work more efficiently.
Proposed solution:
You create a DAX expression that uses the FILTER function to limit the data.Does this solution meet the goal?
CorrectIncorrect -
Question 41 of 233
41. Question
41. This question is part of a scenario-based series where each proposed solution must be evaluated independently.
You are developing a Power BI data model that includes a very large SQL Server table named Order with over 100 million rows.
During the development phase, you want to import only a subset (sample) of the data from the Order table to improve performance and speed up development.
Proposed solution:
You modify the SQL query used to retrieve the data by adding a WHERE clause to limit the rows returned.Does this solution meet the goal?
CorrectIncorrect -
Question 42 of 233
42. Question
42. You are working with a Power BI data model similar to the one shown in the exhibit.
The Departments table contains four departments.You must make sure that each user can view data only for their own department.
What is the correct approach?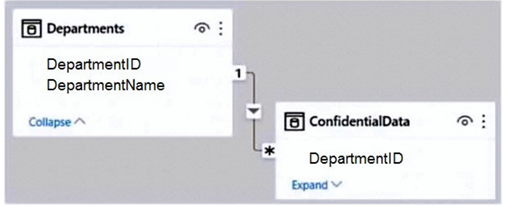 CorrectIncorrect
 -
Question 43 of 233
43. Question
43. You are designing a Power BI Desktop report that includes two tables, and row-level security (RLS) is already configured on both of them.
You need to create a relationship between these tables so that:
Bidirectional cross-filtering works correctly, and
RLS rules are fully respected and enforced across both tables.What should you do?
CorrectIncorrect -
Question 44 of 233
44. Question
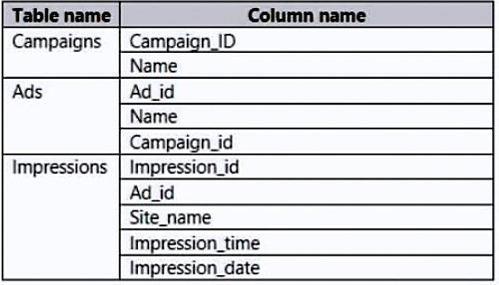
44. You have several tables, including an Impressions table that grows by about 30 million rows every month.
You need to build an ad analytics model that can:
Show daily impression counts by campaign and site_name
Support reporting for the last 12 months
Keep the data model as small as possibleWhich two actions should you take?
 CorrectIncorrect
 -
Question 45 of 233
45. Question
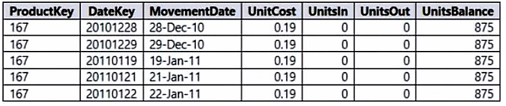
45. You import a Power BI dataset that contains the following tables:
Date
Product
Product InventoryThe Product Inventory table is very large, containing 25 million rows.
It is related to:
Date via DateKey
Product via ProductKeyYou want to reduce the size of the data model while preserving all analytical value (that is, without losing any meaningful information needed for reporting).
What should you do?
 CorrectIncorrect
 -
Question 46 of 233
46. Question
46. This question is part of a scenario-based series. Each question evaluates whether a proposed solution meets a specific goal.
You are building a Power BI data model that includes a very large SQL Server table named Order with more than 100 million rows.
During development, you want to work with only a sample of the data from the Order table to improve performance and speed up modeling.
Proposed solution:
You apply a report-level filter that restricts the data based on the order date.Does this solution meet the goal?
CorrectIncorrect -
Question 47 of 233
47. Question
47. This question is part of a scenario-based series. Each proposed solution must be evaluated independently.
You have a Power BI report that imports data from an Azure SQL database, including:
A Date table
A Sales tableThe Sales table contains multiple date foreign keys:
Due Date
Order Date
Delivery DateYou need to enable time-based analysis of sales using all three date columns.
Proposed solution:
You create inactive relationships between the Sales table and the Date table for each date foreign key.Does this solution meet the goal?
CorrectIncorrect -
Question 48 of 233
48. Question
48. This question is part of a scenario-based series. Each question evaluates whether a proposed solution meets the stated requirement.
You have a Power BI report that imports data from an Azure SQL database, including:
A Date table
A Sales tableThe Sales table contains multiple date foreign keys:
Due Date
Order Date
Delivery DateYou need to enable time-based analysis of sales using all three date columns.
Proposed solution:
In Power Query Editor, you rename the Date query to Due Date, then reference it twice to create separate queries for Order Date and Delivery Date.Does this solution meet the goal?
CorrectIncorrect -
Question 49 of 233
49. Question
49. This question is part of a scenario-based series. Each question evaluates whether a proposed solution satisfies the stated requirement.
You have a Power BI report that imports data from an Azure SQL database, including:
A Date table
A Sales tableThe Sales table contains multiple date foreign keys:
Due Date
Order Date
Delivery DateYou must support time-based sales analysis using all three date columns.
Proposed solution:
From the Fields pane, you rename the Date table to Due Date, then use DAX to create two additional calculated tables for Order Date and Delivery Date.Does this solution meet the goal?
CorrectIncorrect -
Question 50 of 233
50. Question
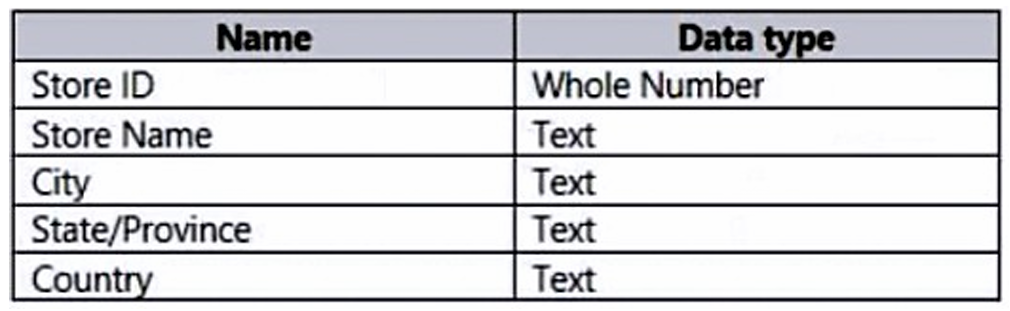
50. You are building a Power BI data model that includes a table named Store with location-related fields.
You plan to create a map visual that displays store locations and allows users to drill down geographically from:
Country
to State/Province
to CityWhat should you do to ensure that Power BI correctly interprets and maps these location fields?
 CorrectIncorrect
 -
Question 51 of 233
51. Question
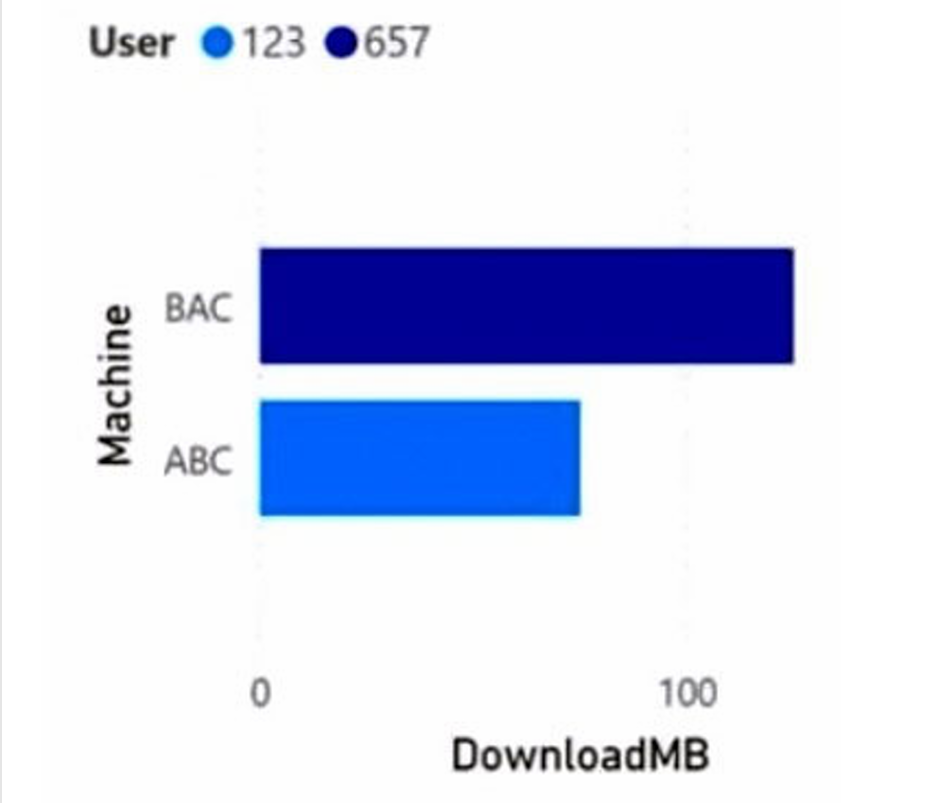
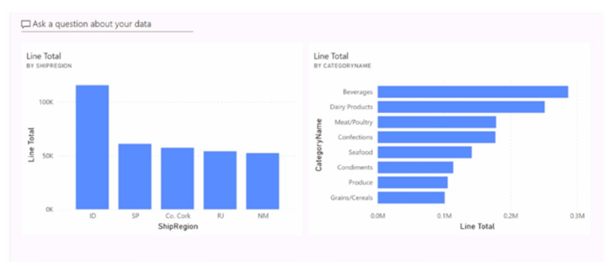
51. You’re building a Power BI data model for a report.
Your source data includes a single combined column called Machine-User (formatted as shown in the table).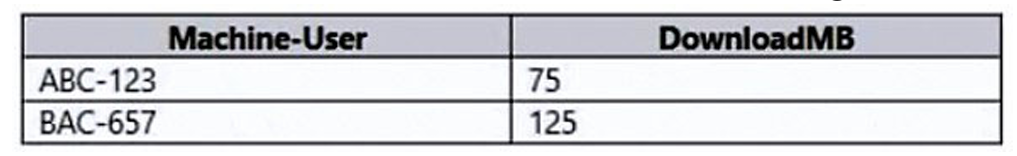
You need to produce a clustered bar chart like the one in the exhibit, which requires Machine and User to be treated as separate fields.
What should you do?
 CorrectIncorrect
 -
Question 52 of 233
52. Question
52. You are working with a Power BI report that imports a date table and a sales table from an Azure SQL database.
The sales table includes the following date fields
Due Date
Order Date
Delivery DateYou need to enable time-based analysis of sales using all three date fields.
Proposed solution:
Create measures that use the USERELATIONSHIP DAX function to filter sales using the active relationship between the sales table and the date table.Does this solution meet the requirement?
CorrectIncorrect -
Question 53 of 233
53. Question
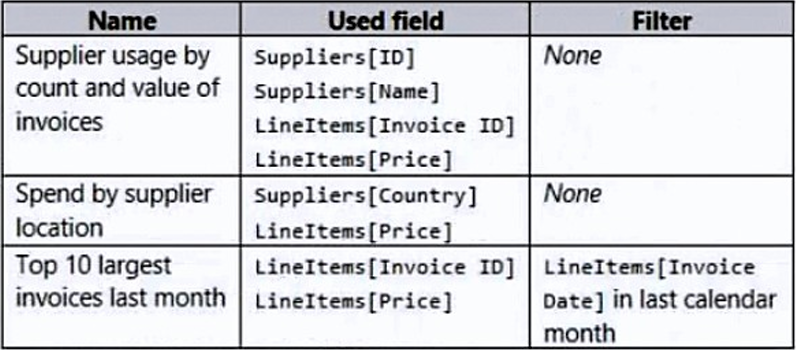
53. You are working with a Power BI report created for the procurement team.
The report uses data from multiple tables, including Suppliers and LineItems, which are linked by a one-to-many relationship using ID and Supplier ID.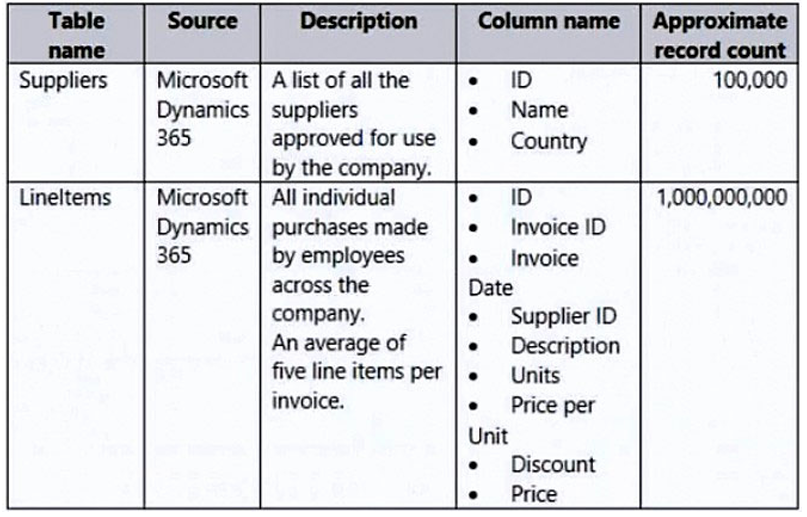
Several visuals in the report depend on this data.
You want to reduce the overall dataset size while ensuring that the existing visuals continue to work exactly as they do now.What action should you take?
 CorrectIncorrect
 -
Question 54 of 233
54. Question
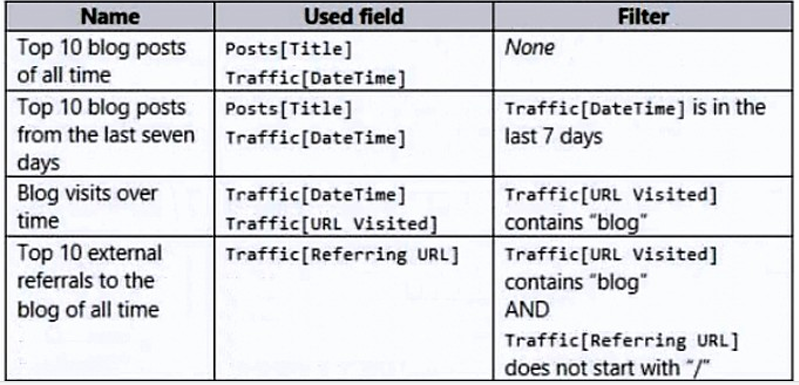
54. You are working on a Power BI report for the marketing team that analyzes blog website traffic. The report uses data from two tables: Posts and Traffic.
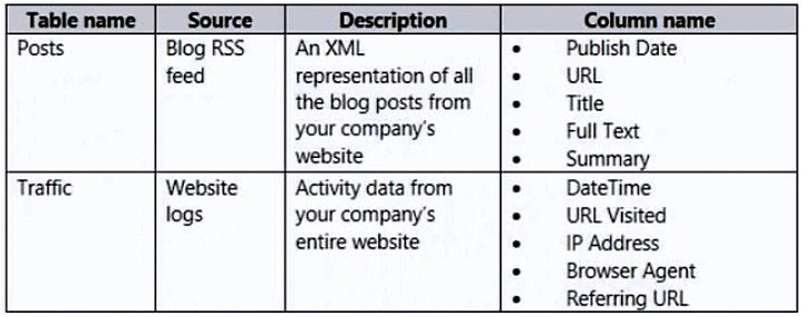
A one-to-many relationship exists between Posts[URL] and Traffic[URL Visited]. The report includes several visuals based on this data, but the dataset refresh process is taking too long.
You need to update the Posts and Traffic queries to improve refresh performance.
Which two actions should you take to reduce the load time? Each correct answer represents part of the solution.
 CorrectIncorrect
 -
Question 55 of 233
55. Question
55. You are working with a Power BI data model like the one shown in the exhibit.
The Sales table stores daily sales records covering the past five years up to the current date.
You want to create a measure that returns total sales for March 2021 when March 2022 is selected in the report.
Which DAX expression should you use?
 CorrectIncorrect
 -
Question 56 of 233
56. Question
56. You are using Power BI Desktop to load data from a Microsoft SQL Server database.
While the data is loading, an error message appears indicating a problem with the query execution.
You need to fix the issue so the data can load successfully.
Which two actions can resolve the problem? Each correct answer represents a complete solution.
 CorrectIncorrect
 -
Question 57 of 233
57. Question
57. This question is part of a scenario-based series. Each question proposes a different solution that may or may not satisfy the stated requirements.
Once you answer this question, you cannot return to it.
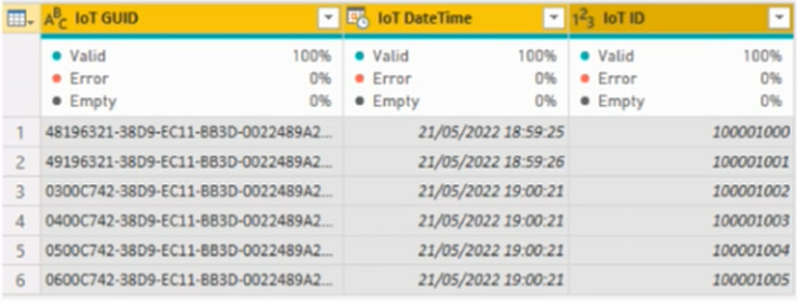
In Power Query Editor, you are reviewing the data profile shown in the exhibit.
The IoT GUID and IoT ID columns contain unique values for every row.
You need to analyze IoT events by hour and by day of the year, while also improving dataset performance.
Proposed solution:
You split the IoT DateTime column into two separate columns: Date and Time.Does this solution meet the requirement?
 CorrectIncorrect
 -
Question 58 of 233
58. Question
58. This question is part of a scenario-based series. Each question suggests a different solution that may or may not satisfy the stated objectives.
After answering this question, you will not be able to revisit it.
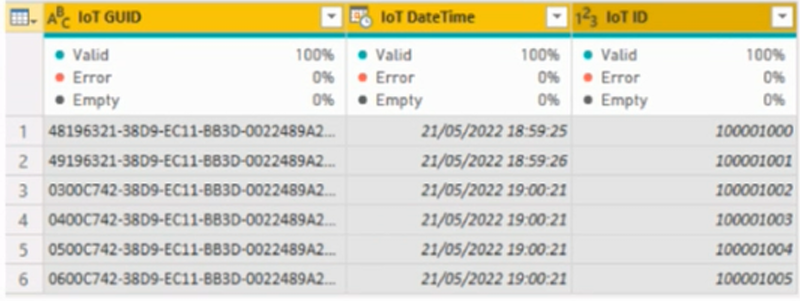
In Power Query Editor, you are reviewing the data profile shown in the exhibit.
The IoT GUID and IoT ID columns both contain unique values for every row.
You need to analyze IoT events by hour and by day of the year, and the solution must improve dataset performance.
Proposed solution:
You remove the IoT GUID column and keep the IoT ID column.Does this solution meet the requirement?
 CorrectIncorrect
 -
Question 59 of 233
59. Question
59. This question belongs to a series based on the same scenario. Each question proposes a different solution that may or may not satisfy the stated objectives.
Once you submit your answer, you cannot return to this question.
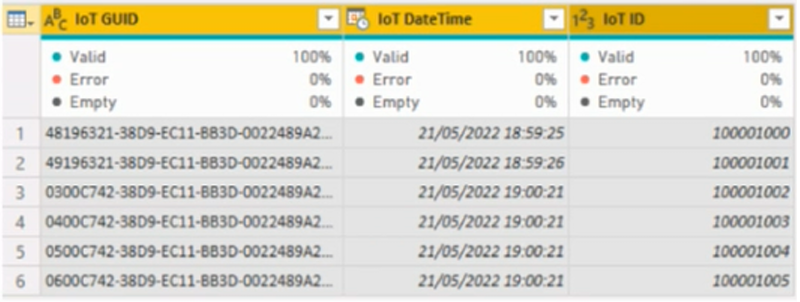
In Power Query Editor, you are reviewing the data profile shown in the exhibit.
Both the IoT GUID and IoT ID columns contain unique values for each row.
You need to analyze IoT events by hour and by day of the year, and the solution must improve the performance of the dataset.
Proposed solution:
You change the IoT DateTime column to use the Date data type.Does this solution meet the requirement?
 CorrectIncorrect
 -
Question 60 of 233
60. Question
60. You are working with a Power BI report that has a PBIX size of 550 MB and is published to an App workspace in shared capacity on PowerBI.com.
The report uses an imported dataset containing a single fact table with 12 million rows. The dataset refreshes twice daily at 8:00 AM and 5:00 PM.
The report consists of one page with 15 AppSource visuals and 10 built-in visuals.
Users report that the visuals load slowly when they open and interact with the report.You need to recommend a way to improve report performance.
What should you recommend?
CorrectIncorrect -
Question 61 of 233
61. Question
61. You have a CSV file that stores user complaints. One of the columns is named Logged, which records the date and time when each complaint was logged.
The Logged column is stored in the following text format:
2018-12-31 at 08:59
You need to analyze complaints by date and use Power BI’s built-in date hierarchy (Year, Quarter, Month, Day).
What should you do?
CorrectIncorrect -
Question 62 of 233
62. Question
62. Note: This question is part of a multi-question scenario. Each question suggests a different solution that may or may not meet the requirements. Once you answer, you can’t go back to review it.
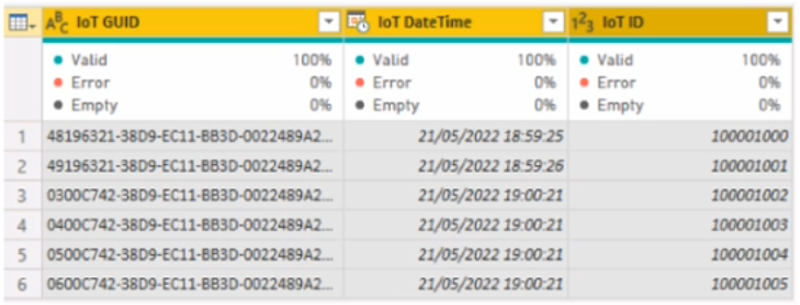
In Power Query Editor, you review a dataset (shown in an exhibit). The columns IoT GUID and IoT ID contain values that are unique for every single row.
You need to:
Analyze IoT events by hour and by day of the year
Use a solution that improves dataset performanceProposed solution:
You add a custom column that combines (concatenates) IoT GUID + IoT ID into one column, then you delete the original IoT GUID and IoT ID columns.Does this solution meet the goal?
 CorrectIncorrect
 -
Question 63 of 233
63. Question
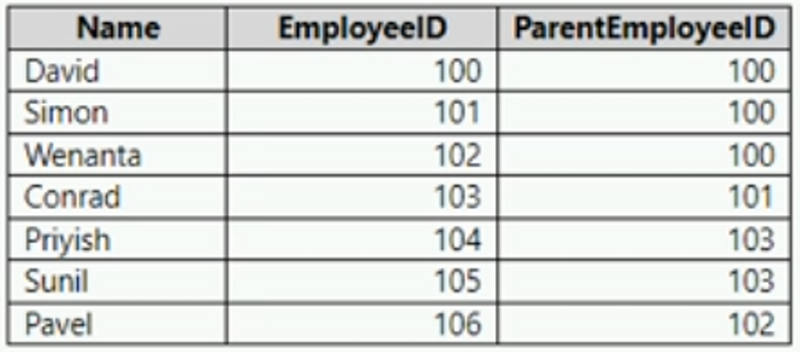
63. You have a Power BI data model with a table named Employee.
Each record represents an employee, and the ParentEmployeeID column identifies that employee’s direct manager.The organizational structure forms a hierarchy where:
Each employee reports to one manager
All reporting chains eventually lead to the CEO at the top
You need to create a calculated column that returns the number of hierarchy levels from each employee up to the CEO.
Which DAX expression should you use?
 CorrectIncorrect
 -
Question 64 of 233
64. Question
64. You have a Microsoft Power BI report with the following characteristics:
The PBIX file size is 550 MB
The report is published to an App workspace in shared capacity on PowerBI.com
The report uses an Import mode dataset
The dataset contains one fact table with 12 million rows
The dataset refreshes twice daily at 08:00 and 17:00The report has one page with:
15 AppSource visuals
10 built-in (default) visualsUsers report that the visuals load slowly when opening and interacting with the report
You need to recommend a solution that will improve report performance.
What should you recommend?
CorrectIncorrect -
Question 65 of 233
65. Question
65. You are using Power Query Editor to preview a query that contains sales order data with the following columns:
Tax Amount
Sales Order ID
Freight Amount
Subtotal Amount
Total Item QuantityKey details:
Sales Order ID uniquely identifies each order
Subtotal Amount and Total Item Quantity are always populated
Tax Amount and Freight Amount may be null when an order has no associated chargeYou need to prepare the data so you can calculate the following monthly metrics:
Average item quantity per order
Average freight amount per order
Maximum item quantity per orderHow should you modify the query?
CorrectIncorrect -
Question 66 of 233
66. Question
66. You have a Power BI data model with a table named Employees that includes the following columns:
Employee ID (unique identifier)
First Name
Last Name
Department
SalaryYou need to create a DAX measure that calculates the average salary of all employees who work in the Sales department.
Which DAX expression should you use?
CorrectIncorrect -
Question 67 of 233
67. Question
67. You have a Power BI data model that includes a table named Employees with the following columns:
Employee Name
Email Address
Start Date
Job TitleYou are configuring dynamic row-level security (RLS).
The security rules must meet these requirements:
Each user can see only their own employee record
The DAX expression must work correctly in both Power BI Desktop and the Power BI serviceWhich table filter expression should you use?
CorrectIncorrect -
Question 68 of 233
68. Question
68. You have a Power BI data model that imports data from a Microsoft Excel file.
Using Power Query, you load a query that includes renamed columns and custom columns.Later, when you try to refresh the query, you receive the following error message:
Expression.Error: The column ‘Category’ of the table wasn’t found.Which two of the following could have caused this error?
CorrectIncorrect -
Question 69 of 233
69. Question
69. You have a Power BI data model with a table named Sales that includes the following columns:
Order Line ID
Product ID
Unit Price
Order ID
QuantityImportant details:
Each Order ID represents one order
An order can contain multiple order lines
Each order line within an order has a different Product ID
You need to create a DAX measure that correctly returns the number of orders.Which DAX expression should you use?
CorrectIncorrect -
Question 70 of 233
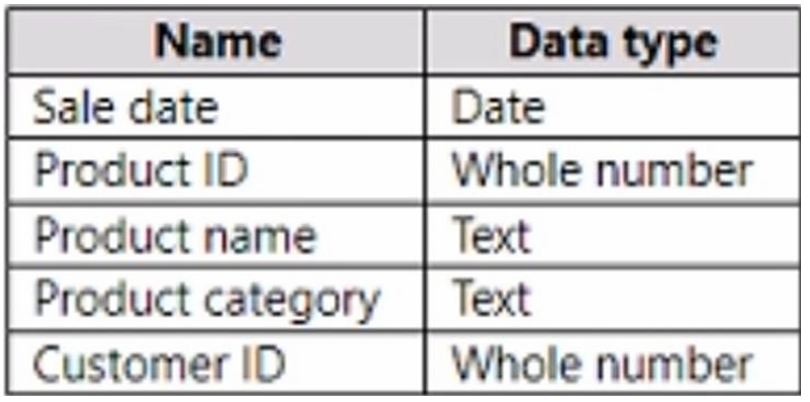
70. Question
70. In Power Query Editor, you have a query named Sales Data that contains sales-related columns.
You need to create two new queries from this source:
Product Dimension
Sales FactThe solution must:
Minimize maintenance effort
Minimize the size of the datasetWhich two actions should you perform?
 CorrectIncorrect
 -
Question 71 of 233
71. Question
71. You have a Power BI data model with a table named Date that contains the following columns:
Date
Fiscal Year
Fiscal Quarter
Month Name
Calendar Year
Week Number
Month Number
Calendar QuarterYou need to create a calculated table derived from the Date table.
The calculated table must include only unique combinations of the following fields:
Calendar Year
Calendar Quarter
Calendar MonthWhich DAX function should you include in the calculated table definition?
CorrectIncorrect -
Question 72 of 233
72. Question
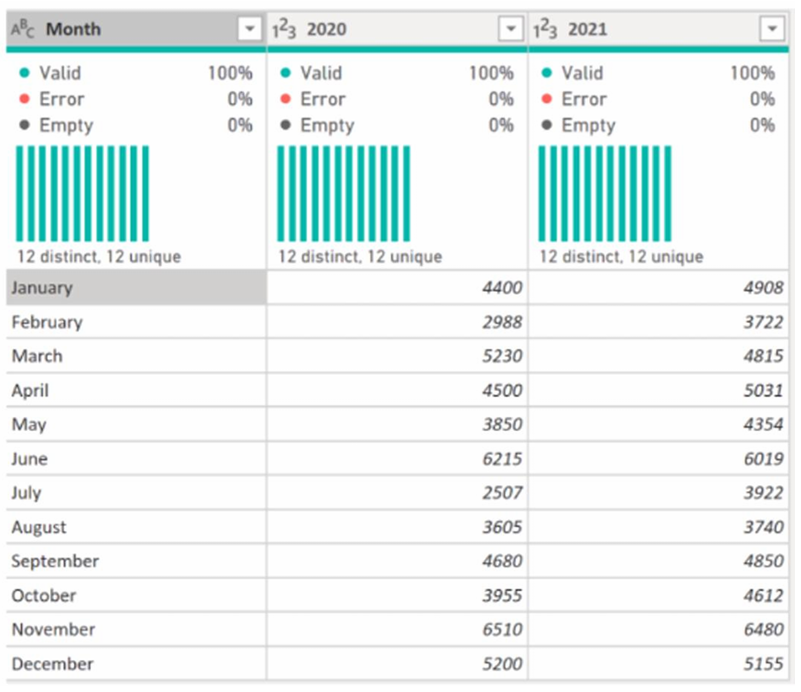
72. You are using Power Query Editor to import and preview sales data for the years 2020 and 2021 from a Microsoft Excel file (as shown in the exhibit).
The data is currently structured with years as separate columns.
You need to reshape the data so that the query outputs exactly three columns:
Month
Sales
YearWhat should you select in Power Query Editor to achieve this result?
 CorrectIncorrect
 -
Question 73 of 233
73. Question
73. Note: This question is part of a scenario-based series. Each question proposes a different solution that may or may not satisfy the stated requirements. Once answered, you cannot return to review this question.
You have a Power BI report that imports data from an Azure SQL Database.
The model includes:
A Date table
A Sales tableThe Sales table contains three date foreign key columns:
Due Date
Order Date
Delivery DateYou need to enable sales analysis over time using all three dates simultaneously.
Proposed solution:
Rename the existing Date table to Due DateCreate two calculated date tables using DAX:
Order Date
Delivery DateCreate active relationships between the Sales table and each of the three date tables
Does this solution meet the goal?
CorrectIncorrect -
Question 74 of 233
74. Question
74. You have a Power BI data model that includes:
A Date table related to a Sales table by the Date column
An existing measure:
Total Sales = SUM(Sales[Sale])You need to create another measure named Previous Quarter that returns the total sales for the quarter immediately before the currently selected period.
Which DAX calculation should you use?
 CorrectIncorrect
 -
Question 75 of 233
75. Question
75. You have a Power BI data model with two tables:
Sales
DateThe Sales table contains the following measures:
Order Quantity
Product Cost
Sales AmountYou need to create the visual shown in the exhibit, which displays these measures together.
In which section of the Fields well should you place the measures?
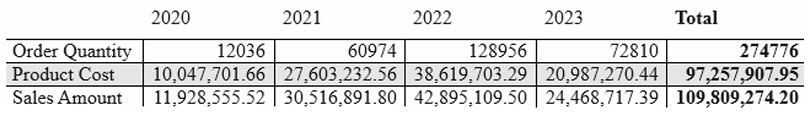 CorrectIncorrect
 -
Question 76 of 233
76. Question
76. You are reviewing a Power BI data model that includes a calculated table defined by the following DAX expression:
ProductList = INTERSECT(ProductsGroupA, ProductsGroupB )
You need to determine which rows are returned in the ProductList table.
Which rows will be included?
CorrectIncorrect -
Question 77 of 233
77. Question
77. Note: This question is part of a scenario-based series. Each question proposes a different solution that may or may not meet the stated goals. Once you answer, you cannot return to review this question.
You have a Power BI report that imports data from an Azure SQL Database.
The model includes:
A Date table
A Sales tableThe Sales table contains three date foreign key columns:
Due Date
Order Date
Delivery DateYou need to enable analysis of sales over time using all three date columns.
Proposed solution:
You create measures that use the USERELATIONSHIP() DAX function to activate the inactive relationships between the Sales table and the Date table when required.Does this solution meet the goal?
CorrectIncorrect -
Question 78 of 233
78. Question
78. Note: This question is part of a scenario-based series. Each question presents a different solution that may or may not meet the stated requirement. Once answered, you cannot return to review this question.
You have a Power BI report that imports data from an Azure SQL Database.
The model includes:
A Date table
A Sales tableThe Sales table contains three date foreign key columns:
Due Date
Order Date
Delivery DateYou need to enable analysis of sales over time using all three date columns.
Proposed solution:
Rename the existing Date table to Due DateCreate two additional calculated date tables using DAX:
Order Date
Delivery DateCreate active relationships between the Sales table and each date table
Does this solution meet the goal?
CorrectIncorrect -
Question 79 of 233
79. Question
79. You have a Power BI semantic model that includes data for:
Item
Price
CountryThe data is displayed in a report that already uses filters (for example, slicers by country or item).
You need to calculate the average item price for a selected country, and the calculation must respect all existing filters in the report.
Which type of Quick Measure should you use?
CorrectIncorrect -
Question 80 of 233
80. Question
80. You have a Power BI semantic model that includes four queries:
Query1
Query2
Query3
Query4Query1 loads customer data into the model and is referenced by the other three queries.
You notice that data refresh is slow, and you need to improve refresh performance while minimizing costs.
What should you do?
CorrectIncorrect -
Question 81 of 233
81. Question
81. You have a Power BI semantic model that connects to a streaming data source which updates very frequently.
You need to build a Power BI report that satisfies all of the following requirements:
Supports real-time analytics
Minimizes performance impact on the source system
Shows the most recent data instantly, without requiring a dataset refresh
Which connectivity mode should you use for the dataset?
CorrectIncorrect -
Question 82 of 233
82. Question
82. You have a Power BI report named Summary1 and notice that it is slow to load or interact with.
To investigate, you run Performance Analyzer in Power BI Desktop to review performance metrics for the report.
Which two metrics in Performance Analyzer show the execution duration (time taken)?
NOTE: Each correct answer is worth one point.
CorrectIncorrect -
Question 83 of 233
83. Question
83. You have a Microsoft 365 subscription that includes several resources (as shown in an exhibit).
You create a new Power BI dashboard that uses row-level security (RLS) and define a new security role named Consultants.
You need to assign the Consultants role to an appropriate resource.
To which resource can you assign the Consultants role?
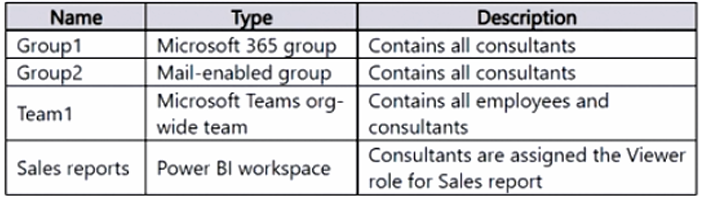 CorrectIncorrect
 -
Question 84 of 233
84. Question
84. You have a Power BI data model with two tables:
Sales
DateThe Sales table is related to the Date table using a many-to-one relationship and contains the following columns:
Date
Product
SalesAmountYou need to create a DAX measure that calculates a rolling 31-day total of sales, meaning:
It returns the total SalesAmount for the selected datePlus the previous 30 days
Which DAX expression should you use?
CorrectIncorrect -
Question 85 of 233
85. Question
85. You publish a Power BI semantic model to the Power BI service.
The model connects to the following data sources:Source1: A Microsoft Excel file stored in Microsoft OneDrive for Business
Source2: An Azure SQL Database hosted on a virtual network (VNet)
Source3: A public website
You need to determine which data source requires an on-premises data gateway.
Which option is correct?
CorrectIncorrect -
Question 86 of 233
86. Question
86. You have a Power BI semantic model built with two queries.
A report that uses this model is experiencing performance issues.You plan to optimize performance by reducing the amount of data loaded into the model using Power Query.
Which two actions should you perform?
NOTE: Each correct answer is worth one point.
CorrectIncorrect -
Question 87 of 233
87. Question
87. Note: This question is part of a scenario-based series. Each question proposes a different solution that may or may not meet the stated goal. Once answered, you cannot return to review it.
You have an on-premises data gateway.
You want to reduce the amount of data sent through the gateway for semantic models that use Import storage mode.Proposed solution:
Create aggregations to summarize results.
Does this solution meet the goal?CorrectIncorrect -
Question 88 of 233
88. Question
88. Note: This question is part of a scenario-based series. Each question proposes a different solution that may or may not meet the stated goal. Once answered, you cannot return to review it.
You have an on-premises data gateway.
You need to reduce the amount of data sent through the gateway by semantic models running in Import storage mode.Proposed solution:
Increase Automatic page refresh intervals.
Does this solution meet the goal?CorrectIncorrect -
Question 89 of 233
89. Question
89. Note: This question is part of a scenario-based series. Each question proposes a different solution that may or may not meet the stated goal. Once answered, you cannot return to review it.
You have an on-premises data gateway.
You need to reduce the amount of data sent through the gateway for semantic models that use Import storage mode.Proposed solution:
Configure incremental refresh.
Does this solution meet the goal?CorrectIncorrect -
Question 90 of 233
90. Question
90. Note: This question is part of a scenario-based series. Each question proposes a different solution that may or may not meet the stated goal. Once answered, you cannot return to review it.
You have an on-premises data gateway.
You need to reduce the amount of data sent through the gateway for semantic models that use Import storage mode.Proposed solution:
Decrease the dashboard cache update frequency.
Does this solution meet the goal?CorrectIncorrect -
Question 91 of 233
91. Question
91. You have a Power BI semantic model named Model1 that uses Import storage mode.
You need to reduce the size of Model1, and the solution must not increase report query response times.
What should you do?CorrectIncorrect -
Question 92 of 233
92. Question
92. You have a Power BI semantic model named Model1 that uses Import storage mode.
You need to reduce the size of Model1.
Which two actions should you perform?CorrectIncorrect -
Question 93 of 233
93. Question
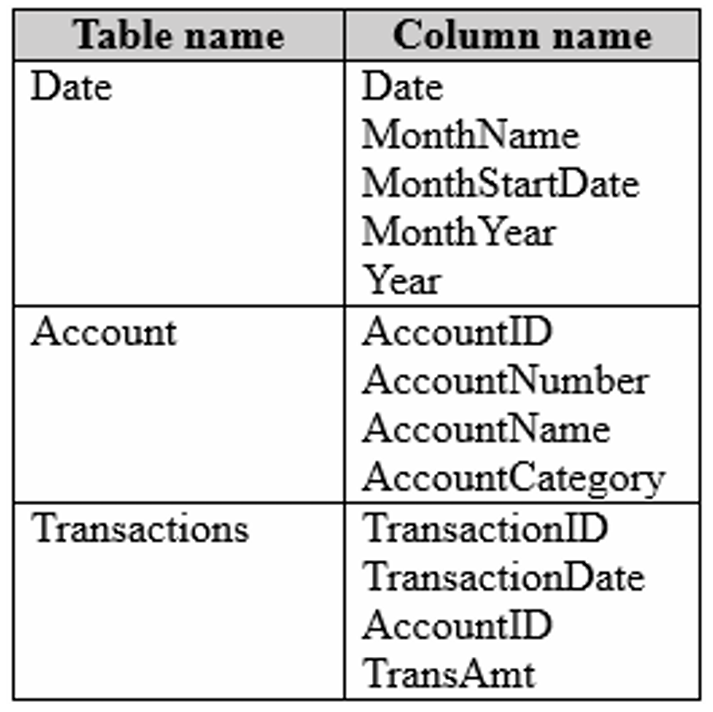
93. You have a Power BI semantic model with transaction data.
You need to design a solution that meets all of these requirements:
Shows monthly total transaction amounts for the current year and previous year
Uses a star schema modeling approach
Minimizes the size of the data modelWhich three actions should you perform?
 CorrectIncorrect
 -
Question 94 of 233
94. Question
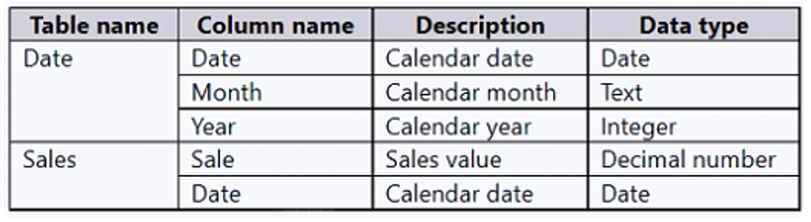
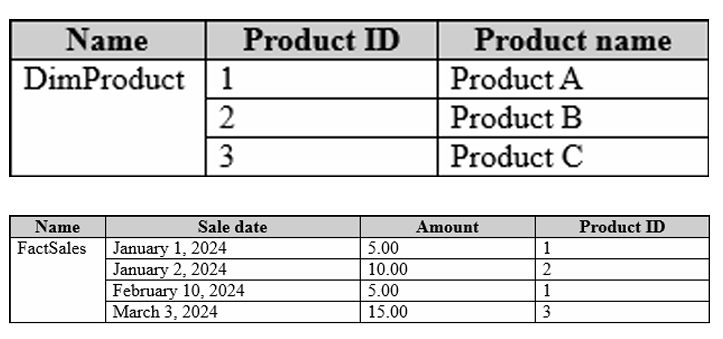
94. You have a Power BI semantic model named Model1 with two tables:
DimDate (marked as the Date table)
FactSales
There is an active relationship between DimDate and FactSales.
The FactSales table contains sales data (as shown in the exhibit).
The model includes the following measure:Previous Year Sales =CALCULATE( [Sales Amount],PREVIOUSYEAR(‘Date'[Date]))
You create a report that uses Model1.
The report contains one page, and a page-level filter is set to:
May 9, 2024The Previous Year Sales measure is displayed in a card visual.
What value will appear in the card?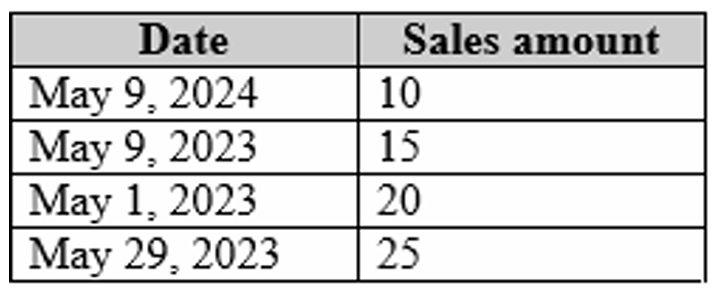 CorrectIncorrect
 -
Question 95 of 233
95. Question
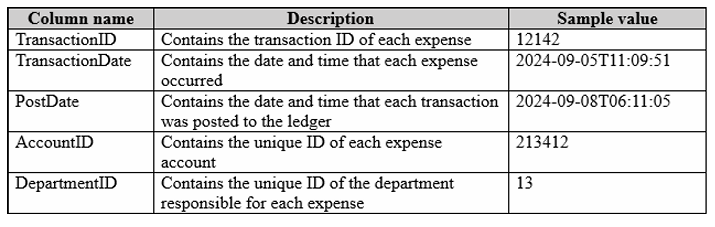
95. You have a Power BI query named Expenses that imports expense data.
The table includes a TransactionDate column that contains both date and time values.Users perform analysis using only the date portion of TransactionDate.
You need to reduce the model size while ensuring that analysis results remain unchanged.Which two actions should you take?
 CorrectIncorrect
 -
Question 96 of 233
96. Question
96. You have a Power BI semantic model with two tables:
DimCustomer (dimension table)
Primary key: CustomerID
FactOrderDetails (fact table)
Contains CustomerID
Multiple rows can share the same CustomerIDYou need to create a relationship from FactOrderDetails to DimCustomer.
The relationship must optimize query performance.What should you create?
CorrectIncorrect -
Question 97 of 233
97. Question
97. You have a Power BI data model with a table named Expenses that includes the following columns:
Date
Amount
Category
Expense ID
Employee ID
Each expense is recorded by an employee, and each expense has a unique Expense ID.You need to create a DAX measure that calculates the total amount of expenses.
Which DAX expression should you use?CorrectIncorrect -
Question 98 of 233
98. Question
98. You are working in Power Query Editor with a query that contains a column named Classes.
Each cell in the Classes column contains multiple values separated by a delimiter.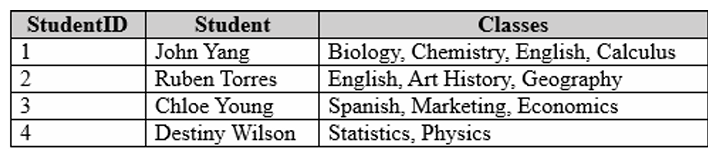
You need to transform the data so that:
Each class appears on its own row
The resulting table matches the structure shown in the exhibit
What should you do? CorrectIncorrect
 -
Question 99 of 233
99. Question
99. You have a Microsoft Fabric Eventhouse named Eventhouse1 that stores high-velocity, high-volume IoT data.
Eventhouse1 supports near-real-time (NRT) querying for reports.
You want to use Power BI Desktop to build a report that shows both historical data and live data.
The solution must minimize development effort.What should you do?
CorrectIncorrect -
Question 100 of 233
100. Question
100. You have a Power BI semantic model with a fact table (FactSales) and a dimension table (DimProduct).
You need to create a relationship from FactSales to DimProduct.
The solution must ensure the fastest DAX query performance.Which cardinality should you use?
 CorrectIncorrect
 -
Question 101 of 233
101. Question
101. You have a Power BI semantic model that contains a table named Table1.
Table1 currently uses Import storage mode.You need to change the storage mode of Table1 to DirectQuery.
What should you do?CorrectIncorrect -
Question 102 of 233
102. Question
102. You have a Power BI semantic model with tables and relationships as shown in the exhibit.
Based on the model design, what type of dimension does Dim Address represent?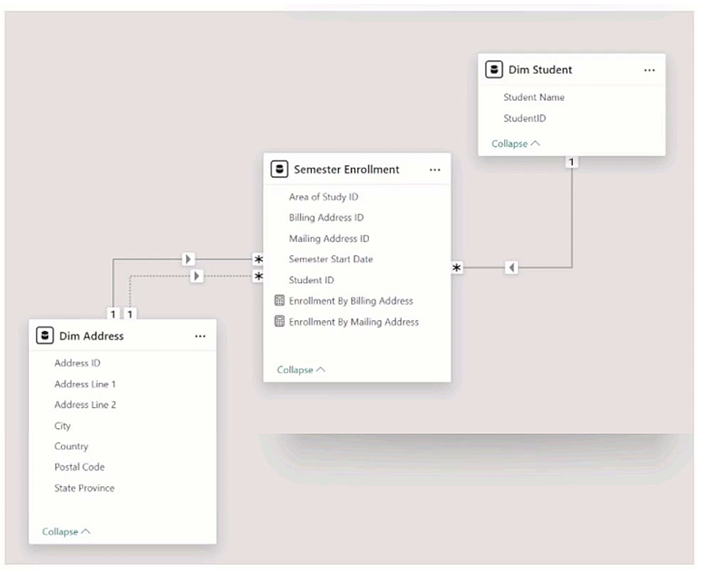 CorrectIncorrect
 -
Question 103 of 233
103. Question
103. You have a Power BI report with two visuals:
A bar chart that shows customer count by customer segment
A column chart that shows sales by monthYou want the following behavior:
When a customer segment is selected in the bar chart
The column chart should show which portion of each month’s total sales belongs to that selected segmentHow should the visual interaction be configured for the column chart when the bar chart is selected?
CorrectIncorrect -
Question 104 of 233
104. Question
104. A user creates a Power BI report named ReportA that uses a custom theme.
You then create a dashboard named DashboardA.You need to ensure that DashboardA uses the same custom theme as ReportA, while minimizing development effort.
Which two actions should you perform?CorrectIncorrect -
Question 105 of 233
105. Question
105. You need to create a visualization that compares revenue and cost over time.
Which type of visualization should you use?CorrectIncorrect -
Question 106 of 233
106. Question
106. You are building a Power BI report to help the sales team understand:
Overall sales performance
The drivers (factors) that influence sales success
The team wants a single visualization that clearly identifies which factors affect success.Which type of visualization should you use?
CorrectIncorrect -
Question 107 of 233
107. Question
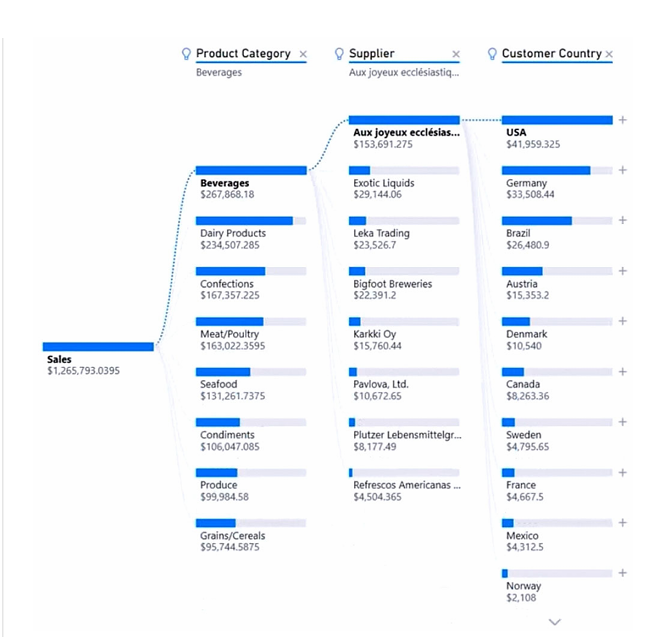
107. You use a Key influencers visual to analyze which factors affect the quantity of items sold per order.
Several fields (Customer Country, Product Category, Supplier info, Product info, Customer City, etc.) are placed in Explain by.Based on the results shown in the visual, what can you identify?
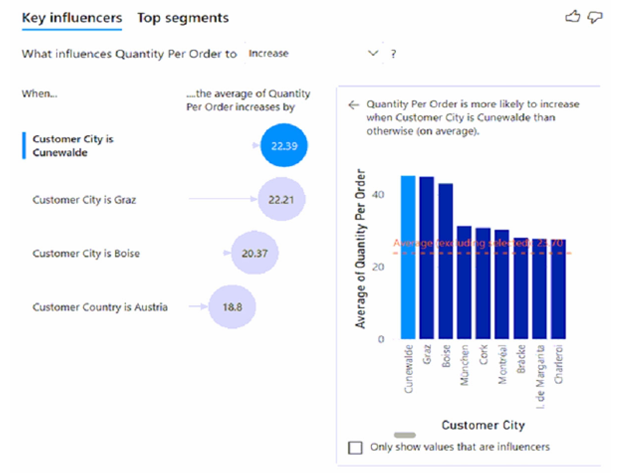 CorrectIncorrect
 -
Question 108 of 233
108. Question
108. You have a Power BI report with four pages.
Each page contains slicers for the same four fields.
Users report that when they make a selection on one page, the selection does not carry over to the other pages.
You need a solution so users can select a value once and have it filter all pages.Which two recommendations will achieve this?
CorrectIncorrect -
Question 109 of 233
109. Question
109. You have a Power BI report with a card visual.
You need to apply conditional formatting to the data label font color, with minimal design effort:
≥ 100 → Dark red
< 100 → Dark grayWhich type of conditional formatting should you use?
CorrectIncorrect -
Question 110 of 233
110. Question
110. You are creating a dashboard in the Power BI service.
You already have a report page that contains three charts with interactive behavior (for example, cross-filtering and highlighting between charts).
You need to add these charts to a dashboard while preserving the interactivity between them.What should you do?
CorrectIncorrect -
Question 111 of 233
111. Question
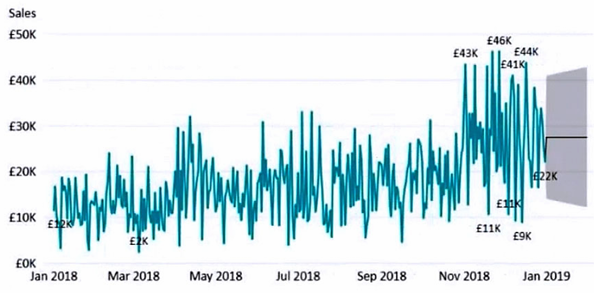
111. You want to create the chart shown in the exhibit, which includes a dashed horizontal line indicating the 40th percentile of daily sales for the displayed period.
How should you create the dashed horizontal line?
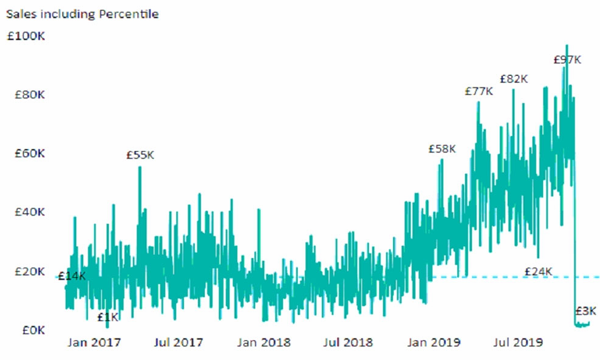 CorrectIncorrect
 -
Question 112 of 233
112. Question
112. You are designing a Power BI report that will be viewed on mobile devices.
The report must display data dynamically based on each user’s geographic location.Which two actions are required to ensure the report correctly recognizes and uses location-based data?
Each correct answer represents part of the solution.CorrectIncorrect -
Question 113 of 233
113. Question
113. A Power BI report includes a donut chart and a clustered column chart.
The interactions between the visuals are currently set to the default behavior.
You want the donut chart to update (redraw) and display data only for the selected column when a user clicks a column in the clustered column chart.What action should you take?
CorrectIncorrect -
Question 114 of 233
114. Question
114. You are building a report in Power BI Desktop and need to add a visual that:
Automatically generates insights such as trends and key observations
Dynamically updates based on selections made in other visuals on the report pageWhich type of visual should you use?
CorrectIncorrect -
Question 115 of 233
115. Question
115. In Power BI Desktop, you have a dataset containing a table with a column named Plant Image that stores image URLs.
You added a table visual to a report page (as shown in the exhibit).
Right now, the table shows the URL text.
You want the table visual to display the actual image (render the picture) instead of showing the URL.What should you do?
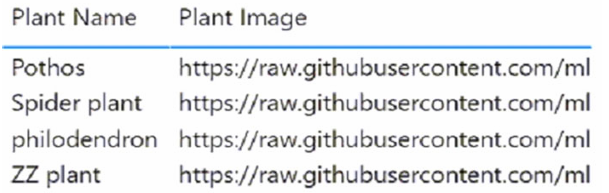 CorrectIncorrect
 -
Question 116 of 233
116. Question
116. Note: This question is part of a multi-question scenario. Each question proposes a different solution that may or may not satisfy the stated requirement.
You have a clustered bar chart with:
A measure called Salary used as the value
A field called Employee used as the axis
The Salary values represent actual monetary amounts in US dollars.
You want to add a reference line that indicates which employees earn more than the median salary.Proposed solution:
Add a constant line and set its value to 0.5.Does this solution meet the requirement?
CorrectIncorrect -
Question 117 of 233
117. Question
117. Note: This question is part of a scenario-based series. Each question suggests a different approach that may or may not satisfy the requirement. Once answered, you can’t return to it.
You have a clustered bar chart where:
Salary (a measure) is used as the Values
Employee is used as the Axis
Salary values are numeric amounts in US dollars
You need to add a reference line that helps identify which employees earn above the median salary.Proposed solution:
Add an Average line using the Salary measure.Does this solution achieve the goal?
CorrectIncorrect -
Question 118 of 233
118. Question
118. Note: This question belongs to a series where each question proposes a different solution that may or may not meet the requirement. Once you answer, you cannot return to this question.
You have a clustered bar chart with:
A measure named Salary used as the Values
A field named Employee used as the Axis
Salary values stored as numeric US dollar amounts
You need to add a reference line that indicates which employees earn above the median salary.Proposed solution:
Add a Percentile line using the Salary measure and set the percentile value to 50%.Does this solution satisfy the requirement?
CorrectIncorrect -
Question 119 of 233
119. Question
119. You have a Power BI report published to powerbi.com that shows department expenses for department managers.
The report currently includes a line chart displaying expenses by month.You want users to be able to switch between a line chart and a column chart when viewing the report.
The solution must require minimal development and ongoing maintenance.What should you do?
CorrectIncorrect -
Question 120 of 233
120. Question
120. You have two Microsoft Power BI reports, ReportA and ReportB, each using a different color palette.
You are building a Power BI dashboard that will include two visuals from each report.
You want the dashboard to use a consistent dark theme, while retaining the original colors of the visuals from both reports.Which two actions should you take?
Each correct answer represents part of the solution.CorrectIncorrect -
Question 121 of 233
121. Question
121. You have a line chart that displays the number of employees in a department over time.
You want to view the total salary cost for those employees when hovering over a data point on the chart.What should you do?
CorrectIncorrect -
Question 122 of 233
122. Question
122. You have a visual displayed as shown in the Original exhibit.
You need to modify the visual so that it matches the Modified exhibit.
What should you add to the visual to achieve this result?
CorrectIncorrect -
Question 123 of 233
123. Question
123. You need to build a visual that allows users to interactively and ad-hoc explore data, as illustrated in the exhibit.
Which type of visual should you use?
 CorrectIncorrect
 -
Question 124 of 233
124. Question
124. Your organization operates in 10 different states.
Management has recently classified each state into one of three regions: East, West, or North.
Your existing data model contains employee information by state only and does not include a region field.
A report currently displays employees grouped by state.
You need to quickly view the employees grouped by region.What should you do?
CorrectIncorrect -
Question 125 of 233
125. Question
125. You manage a set of Power BI reports for your company’s HR department.
You need to create a visual that:
Displays historical employee counts, and
Forecasts trends for the next six months.Which type of visualization should you use?
CorrectIncorrect -
Question 126 of 233
126. Question
126. You have a Microsoft Power BI dashboard created from a report that uses an imported dataset sourced from Microsoft SQL Server.
The dashboard activity timeline is shown in the exhibit.What event took place at 12:03:06 PM?
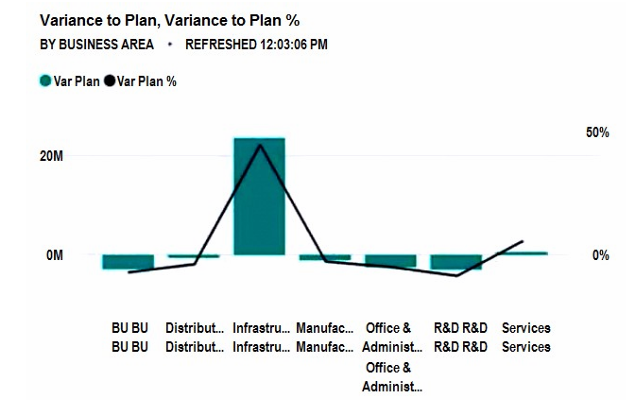
 CorrectIncorrect
 -
Question 127 of 233
127. Question
127. You have a visual displayed as shown in the exhibit.
You want to visualize the relationship between Total Cost and Total Sales over time.What should you do?
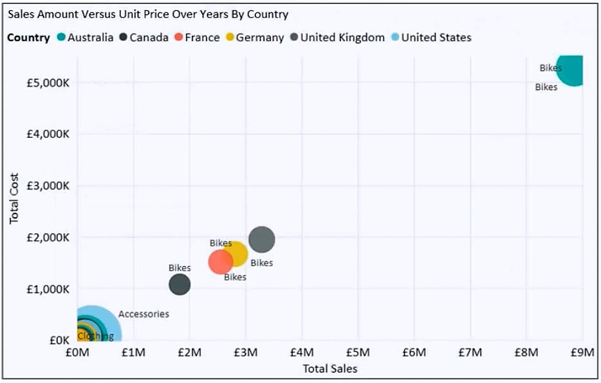 CorrectIncorrect
 -
Question 128 of 233
128. Question
128. You are creating a Power BI report to analyze customer segments.
You want to dynamically break down and explore customer segments based on Bounce Rate, across multiple dimensions such as traffic source, geography, and demographics.
The solution should require minimal analysis effort from the user.Which type of visual should you use?
CorrectIncorrect -
Question 129 of 233
129. Question
129. You have a table that contains sales data with approximately 1,000 rows.
You want to identify outliers in the data.Which type of visualization should you use?
CorrectIncorrect -
Question 130 of 233
130. Question
130. You have a Power BI report with three pages.
One of the pages includes a KPI visual.
You need to apply a filter that affects all visuals across the report, except for the KPI visual.Which two actions should you take to meet this requirement?
CorrectIncorrect -
Question 131 of 233
131. Question
131. You are building a Power BI report to analyze consumer purchasing behavior using a table named Transactions.
The table includes a numeric field called Spend.
You need a visual that can identify which factors or fields most strongly influence Spend.Which type of visual should you use?
CorrectIncorrect -
Question 132 of 233
132. Question
132. You have a Power BI dashboard that contains tiles pinned from a single report, as shown in the Original Dashboard exhibit.
You need to change the dashboard so that it appears like the Modified Dashboard exhibit.
What should you do?
CorrectIncorrect -
Question 133 of 233
133. Question
133. You have a Power BI report with a visual that displays gross sales by date.
Anomaly detection is enabled on the visual, but no anomalies are currently detected.
You want to increase the chance that anomalies are identified in the report.What should you do?
CorrectIncorrect -
Question 134 of 233
134. Question
134. You manage a Power BI workspace that includes a supplier quality dashboard. The dashboard has:
10 card visuals
2 map visuals
5 bar chart visuals
The mobile layout of the dashboard is shown in the exhibit.You need to adjust the mobile layout to meet these requirements:
Show only single-value visuals
Reduce scrolling as much as possibleWhat should you do?
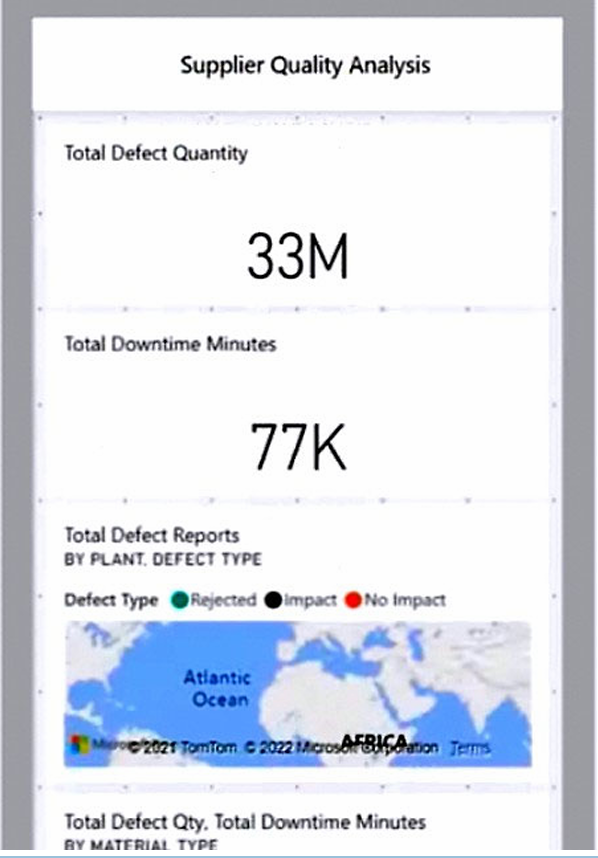 CorrectIncorrect
 -
Question 135 of 233
135. Question
135. You are working with a Power BI report that uses a table named Data1 containing 10 million rows.
The table is used in these visuals:
A card showing the total number of records
A bar chart showing total transaction amount by territory
A scatter plot showing transaction amount vs. profit, with points colored by territoryYou want to improve the scatter plot so users can more easily spot meaningful patterns, without changing the accuracy of the other visuals.
What should you do?
CorrectIncorrect -
Question 136 of 233
136. Question
136. You have a Power BI workspace named Inventory that includes a dataset, a report, and a dashboard.
You need to add a new dashboard tile that displays inventory by location.
This information is not currently shown in the report, and you want to minimize any changes to the report.Which two actions should you take to meet this requirement?
CorrectIncorrect -
Question 137 of 233
137. Question
137. You have a Power BI report with three pages: Page1, Page2, and Page3.
Each page contains the same slicers.
You need to make sure that any filters applied on Page1 also apply to Page3, but do not affect Page2.What should you do?
CorrectIncorrect -
Question 138 of 233
138. Question
138. You have a Power BI report with five pages:
Pages 1–4 are visible
Page 5 is hidden
You want users to be able to quickly navigate from Page 1 to all other visible pages.
The solution must require minimal development and ongoing maintenance, especially as new pages are added to the report.What should you do first?
CorrectIncorrect -
Question 139 of 233
139. Question
139. You have created a Power BI report that displays IoT temperature data streaming from a refrigerator.
The report has been published to the Power BI service.
You need to receive a notification when the temperature exceeds 4°C.What should you do?
CorrectIncorrect -
Question 140 of 233
140. Question
140. You have a Power BI dashboard displayed as shown in the original exhibit.
You need to modify the dashboard so that it appears as shown in the updated exhibit.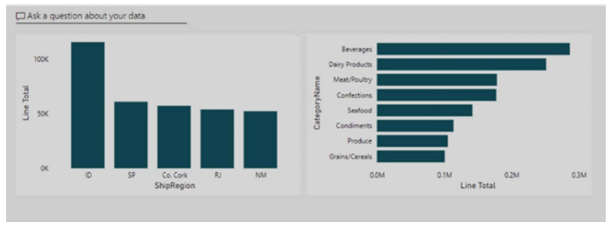
What should you do?
CorrectIncorrect -
Question 141 of 233
141. Question
141. You need to create a Power BI theme that can be reused across multiple reports.
The theme must include corporate branding, such as:
Font sizes
Color schemes
Bar chart formattingWhat should you do?
CorrectIncorrect -
Question 142 of 233
142. Question
142. You have a Power BI report with a single page that includes:
Two line charts
One bar chartYou want users to be able to perform the following actions on all three visuals:
Change the measures used in the visuals
Switch the visualization type
Add or modify a legend
The solution must require minimal development effort.What should you do?
CorrectIncorrect -
Question 143 of 233
143. Question
143. Note: This question is part of a scenario-based series. Each question proposes a different solution that may or may not satisfy the requirement. Once answered, you cannot return to this question.
You have a clustered bar chart where:
Salary (a measure) is used as the Values
Employee is used as the Axis
Salary values are numeric amounts in US dollars
You need to add a reference line that indicates which employees earn above the median salary.Proposed solution:
Add a Median line using the Salary measure.Does this solution meet the requirement?
CorrectIncorrect -
Question 144 of 233
144. Question
144. You have a Power BI report with four pages, and each page includes a slicer for a field named Country.
You need to ensure that:
A country selected on Page 1 is also applied to Page 2 and Page 3, and
Page 4 is not affected by selections made on the other pages.What should you do?
CorrectIncorrect -
Question 145 of 233
145. Question
145. You want to use Power BI to generate sales invoices for customers.
The solution must meet these requirements:
Invoices must be exported as PDF files
The exported PDFs must clearly display all rows and columns without truncationWhat should you create?
CorrectIncorrect -
Question 146 of 233
146. Question
146. You have a Power BI report page that includes:
A shape named Shape1
A card visual named Sales Summary
A clustered bar chart named Sales by Region
You want to make sure that the Sales Summary card appears on top of (in front of) Shape1.What should you modify?
CorrectIncorrect -
Question 147 of 233
147. Question
147. You have a Power BI report named Report1 and a dashboard named Dashboard1.
Report1 includes a visual called Sales by month, which is initially a line chart and has been pinned to Dashboard1.
Later, in Report1, you change the Sales by month visual from a line chart to a bar chart.
You want the bar chart version to appear on Dashboard1.What should you do?
CorrectIncorrect -
Question 148 of 233
148. Question
148. In Power BI Desktop, you are building a report that will include three pages.
You need to create a custom tooltip page and ensure it is properly configured for use as a tooltip.Which three actions should you perform to prepare the tooltip page?
CorrectIncorrect -
Question 149 of 233
149. Question
149. You have a Microsoft Power BI report named ReportA.
Your Power BI tenant allows users to export data.
You need to make sure that report consumers cannot export data from any visuals in ReportA.Which two actions should you perform?
Each correct answer represents a complete solution.CorrectIncorrect -
Question 150 of 233
150. Question
150. You have a Power BI report that will be displayed on a vertical screen.
You want to maximize the usable screen space so the report fits the vertical layout as effectively as possible.What should you do?
CorrectIncorrect -
Question 151 of 233
151. Question
151. You need to create a visual that compares profit across 10 different product categories for a selected quarter.
Which type of visual is best suited to achieve this goal?
CorrectIncorrect -
Question 152 of 233
152. Question
152. You have a Power BI dataset named Finance that is stored in a Power BI workspace.
The finance team is not currently assigned to any workspace roles.
You need to allow the finance team to analyze the Finance dataset using Microsoft Excel.What should you do?
CorrectIncorrect -
Question 153 of 233
153. Question
153. You have a Power BI report with a visual that displays a measure.
You must ensure that:
All values show two decimal places
Negative values appear in red and are enclosed in parenthesesWhich two actions should you take to meet these requirements?
CorrectIncorrect -
Question 154 of 233
154. Question
154. You have a Microsoft Power BI data model with two tables: Population and Date.
Population includes:
PopulationAmount
DateKey (a date representing the first day of a year)
DateKey is related to the Date table in a many-to-one relationship.You define the following measures:
Total Population = SUM(‘Population'[PopulationAmount])
2023 Population = CALCULATE([Total Population], ‘Date'[Year] = 2023)
You then create a table visual that shows Date[Year] and [2023 Population].What will the table display?
CorrectIncorrect -
Question 155 of 233
155. Question
155. You have a Power BI dataset that contains quarterly sales performance data.
You need to provide managers with a way to review the data that:
Is optimized for printing, and
Can be rendered in Microsoft Excel, Word, PowerPoint, and PDF formats.What should you create?
CorrectIncorrect -
Question 156 of 233
156. Question
156. You have a Power BI report that includes several visuals, as shown in the table.
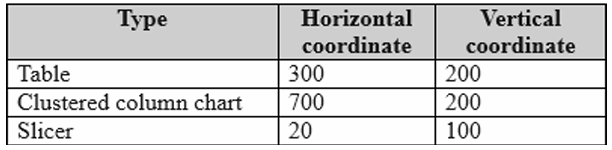
You need to change where each visual is placed on the report canvas.What setting should you modify for each visual?
CorrectIncorrect -
Question 157 of 233
157. Question
157. You have a Microsoft Power BI report that includes a line chart showing sales data across multiple regions.
You want to add an element that allows users to filter the sales data to a selected region.Which two elements can be used to meet this requirement?
Each correct answer represents a complete solution.CorrectIncorrect -
Question 158 of 233
158. Question
158. You have a CSV file structured as shown in the table.
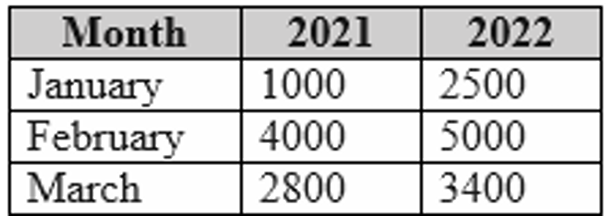
You open the file in Power Query Editor to preview the data.You need to transform the data so that:
The first column contains the month
The second column contains the year
The third column contains the order amount for the corresponding month and yearWhich transformation should you apply first?
CorrectIncorrect -
Question 159 of 233
159. Question
159. You are designing a single-page Power BI report.
Some users will navigate the report using a keyboard, while others will use a screen reader.
You need to make sure that the content on the report page is read and navigated in a logical, accessible order.What should you configure on the report page?
CorrectIncorrect -
Question 160 of 233
160. Question
160. You are configuring a Microsoft Power BI report to improve accessibility.
The report contains three visuals, and you need to adjust their default colors so the report is more usable for people with color vision deficiency.Which two settings should you configure in the Customize theme window to achieve this?
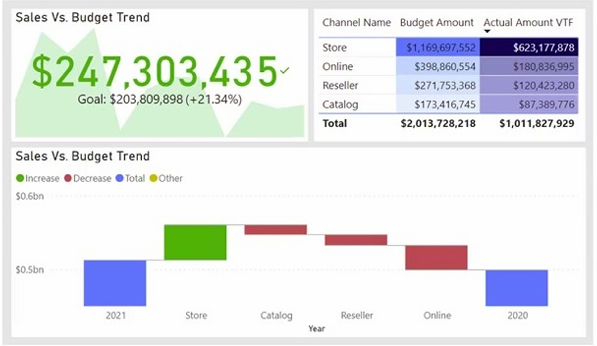 CorrectIncorrect
 -
Question 161 of 233
161. Question
161. You want to use Power BI to create a visual that allows users to compare sales performance across five sales regions for the current month.
Which type of visual should you use?
CorrectIncorrect -
Question 162 of 233
162. Question
162. You have a Power BI report that includes a table with conditional formatting icons.
The icons indicate whether each store is above, near, or below the monthly return quota.
You need to make sure the table is accessible to users with color vision deficiency.What should you do?
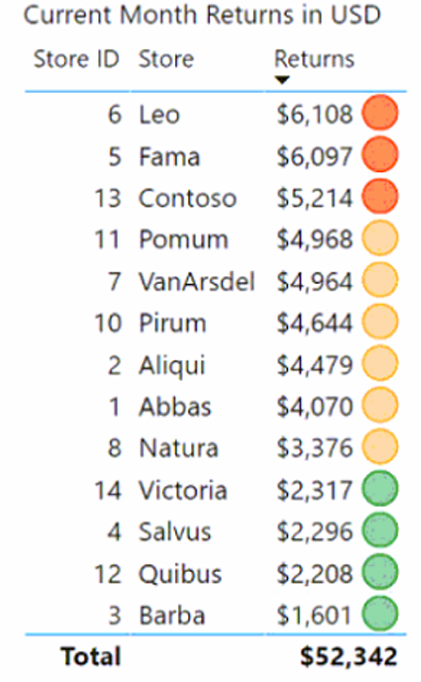 CorrectIncorrect
 -
Question 163 of 233
163. Question
163. You have a Power BI report that contains a single visual.
You want users to be able to change the visual type for their own view without impacting what other users see.What should you do?
CorrectIncorrect -
Question 164 of 233
164. Question
164. You have a Power BI report with a card visual that shows year-to-date revenue.
You need to make sure that screen reader users can hear the value as soon as they interact with the card, and that the value automatically updates whenever the dataset refreshes.What should you do?
CorrectIncorrect -
Question 165 of 233
165. Question
165. You have a Power BI report that includes a table visual with a column of whole numbers ranging from 1 to 20.
You need to apply conditional formatting that meets the following requirements:
Allow users to visually compare values without reading the numeric text
Display a distinct visual representation for each value
Hide the numeric value in the column
Require minimal development effortWhich type of conditional formatting should you use?
CorrectIncorrect -
Question 166 of 233
166. Question
166. You have a Power BI report that includes a table visual, as shown in the exhibit.
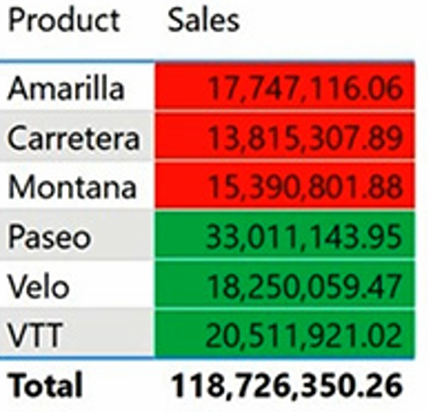
You want to make the visual more accessible for users with color vision deficiency.What should you do?
CorrectIncorrect -
Question 167 of 233
167. Question
167. You have a Power BI app that includes a report named Report1.
You add a new page to Report1 and want to make sure that users can access the new page.
The solution should require minimal administrative effort.What should you do?
CorrectIncorrect -
Question 168 of 233
168. Question
168. You have a Power BI semantic model with a table named Table1 that includes the following columns:
WebsiteName
URLYou need to create a report (Report1) that contains a table visual which:
Displays the website name, and
Allows users to open the corresponding website by selecting the website name.What should you use to meet these requirements?
CorrectIncorrect -
Question 169 of 233
169. Question
169. You have a Power BI semantic model named Model1 with two fields:
Sales
Quarter
The model includes a DAX measure that calculates the total of Sales.
You need to create a report that displays a visual matching the exhibit shown.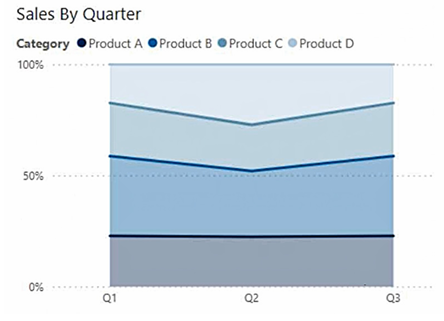
The solution must not require creating any additional DAX measures.Which type of visual should you use?
CorrectIncorrect -
Question 170 of 233
170. Question
170. You have a Power BI report with a bar chart that shows sales by country.
You need to make sure that a summary of the chart’s data can be read by screen reader users.What should you configure on the bar chart?
CorrectIncorrect -
Question 171 of 233
171. Question
171. You want to create a line chart that compares sales data for the last six months across two departments.
You need to improve the accessibility of the visual.What should you do?
CorrectIncorrect -
Question 172 of 233
172. Question
172. You have a Power BI report with a single report page that uses the default theme.
You need to adjust the page so that its appearance matches the formatting shown in the exhibit.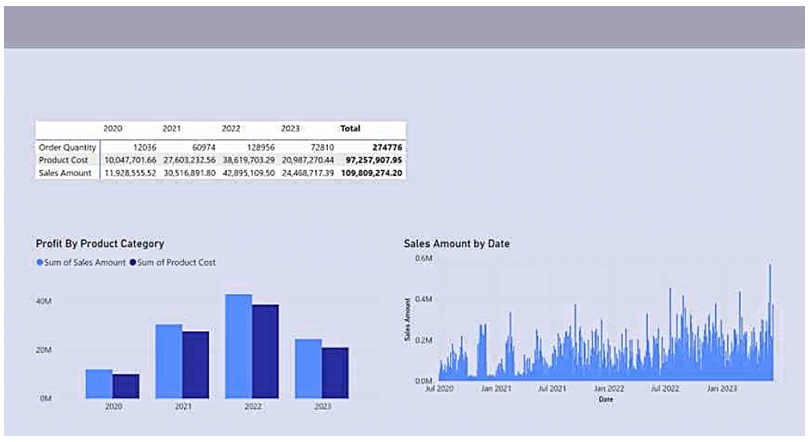
What should you modify on the report page?
CorrectIncorrect -
Question 173 of 233
173. Question
173. You are creating a visual in a Microsoft Power BI report.
The underlying semantic model includes four years of sales data for three products.
You need to show total sales by quarter, broken down by product, and the visual must clearly present trends over time for both:
Overall (total) sales, and
Individual product sales.Which type of visual should you use?
CorrectIncorrect -
Question 174 of 233
174. Question
174. You have a Power BI report with a clustered bar chart where:
Sales is on the X-axis
Year is on the Y-axis
The chart shows data from 2020 to 2024
You need to create a visual calculation that displays a cumulative total of sales, defined as the current year’s sales plus all sales from the previous years.Which DAX expression should you use?
CorrectIncorrect -
Question 175 of 233
175. Question
175. You are building a Power BI report that includes multiple visuals.
You need to make sure the report is accessible to users who rely on screen readers.Which two configurations should you apply?
CorrectIncorrect -
Question 176 of 233
176. Question
176. You have a Power BI report with a stacked bar chart.
You need to add a new field to the legend. This field must combine values from multiple columns into a single label.What should you create?
CorrectIncorrect -
Question 177 of 233
177. Question
177. You manage a Power BI tenant with reports that use financial datasets and are exported as PDF files.
You need to ensure that these exported reports are encrypted.What should you implement?
CorrectIncorrect -
Question 178 of 233
178. Question
178. You have a Microsoft Excel file stored on a file server.
You import a table from the Excel file into Power BI, create a report, and then publish the report.
You need to make sure the data refreshes every four hours.What should you do first?
CorrectIncorrect -
Question 179 of 233
179. Question
179. You have a dataset in Microsoft Power BI that is rarely used and is scheduled to refresh every hour.
You receive a notification indicating that scheduled refresh was disabled due to inactivity.Which two actions will cause the scheduled refresh to resume?
Each correct answer represents a complete solution.CorrectIncorrect -
Question 180 of 233
180. Question
180. You have a Power BI workspace that includes a dataset, a report, and a dashboard.
Access is configured as follows:
External users can view the dashboard
Managers can view the dashboard and a manager-specific report
Employees can view the dashboard and a report restricted by row-level security (RLS)
You want all users (including external users) to be able to flag issues they find on the dashboard by tagging workspace administrators, and you want other users to see the reported issues.What should you use?
CorrectIncorrect -
Question 181 of 233
181. Question
181. You have a PBIX file that imports multiple tables from an Azure SQL Database.
The data is being migrated to a different Azure SQL Database.
You need to update the data connections in the PBIX file, and the solution should require minimal administrative effort.What should you do?
CorrectIncorrect -
Question 182 of 233
182. Question
182. You have a Power BI workspace that contains multiple reports.
You want to allow a user to create a dashboard using visuals from those reports.What should you do?
CorrectIncorrect -
Question 183 of 233
183. Question
183. You have a Power BI report named report1 that uses a shared dataset.
You want to reduce the risk of data exfiltration from report1, and the solution must not impact other reports that use the same dataset.What should you do?
CorrectIncorrect -
Question 184 of 233
184. Question
184. In Power BI Desktop, you’re building visuals in a report that uses an Import model.
You must let users export summarized data from visuals, but block exporting underlying data.What should you do?
CorrectIncorrect -
Question 185 of 233
185. Question
185. You have a Power BI report that enforces row-level security (RLS).
You want an Azure network security team to take over maintaining who belongs to RLS roles.
Requirement: The Azure network security team must not gain permission to manage reports, datasets, or dashboards in Power BI.What should you do?
CorrectIncorrect -
Question 186 of 233
186. Question
186. Your organization has four sales regions, each with several sales managers.
You’ve implemented row-level security (RLS) in a Power BI data model, where each region is mapped to a mail-enabled security group.Current behavior:
Sales managers can see only sales data for their own region
They are blocked from viewing other regionsScenario:
A sales manager is reassigned to a different region.
You need to make sure the sales manager now sees sales data for the new region only.What should you do?
CorrectIncorrect -
Question 187 of 233
187. Question
187. Your organization has over 100 published Power BI datasets.
Out of these, 10 datasets have been validated to meet corporate quality standards.Requirement:
When users search for existing datasets, the 10 validated datasets must appear at the top of the results.What should you do?
CorrectIncorrect -
Question 188 of 233
188. Question
188. You build a Power BI dashboard in the Power BI service that includes a card visual displaying year-to-date total sales.
Users are granted access to the workspace with the Viewer role.
One user wants to automatically receive a daily notification showing the value displayed in the card visual.What should you do?
CorrectIncorrect -
Question 189 of 233
189. Question
189. You have a Power BI workspace called Workspace1. It contains:
a dataset named DS1
a report named RPT1A user needs to:
create a new report using the data in DS1, and
publish that report to a different workspace.You must give the user the minimum access required (least privilege).
What should you do?CorrectIncorrect -
Question 190 of 233
190. Question
190. You have a Power BI workspace that contains five reports and two dashboards.
Requirement:
Give everyone in the organization read-only access to one dashboard and three specific reports.Proposed solution:
You publish a Power BI app and make it available to the entire organization.Does this solution meet the requirement?
CorrectIncorrect -
Question 191 of 233
191. Question
191. You have a Power BI workspace that contains five reports and two dashboards.
Requirement:
Provide read-only access to all users in the organization for one dashboard and three specific reports.Proposed solution:
You enable Included in app for all assets in the workspace.Does this solution satisfy the requirement?
CorrectIncorrect -
Question 192 of 233
192. Question
192. You manage a Power BI workspace that contains five reports and two dashboards.
Requirement:
Allow all users in the organization to have read-only access to one dashboard and three selected reports.Proposed solution:
You assign all organizational users the Viewer role for the entire workspace.Does this solution meet the requirement?
CorrectIncorrect -
Question 193 of 233
193. Question
193. You publish a new dataset and report from Power BI Desktop to a Power BI workspace.
The dataset includes a row-level security (RLS) role named HR.Requirement:
Make sure HR team members have the HR RLS role enforced when they view reports that use this dataset.What should you do?
CorrectIncorrect -
Question 194 of 233
194. Question
194. You have a Power BI dashboard used to monitor manufacturing quality.
The dashboard includes:
A line chart showing the daily count of defective products
A KPI visual displaying the current daily defect percentageRequirement:
You must receive a notification whenever the daily defect percentage goes above 3%.What should you create?
CorrectIncorrect -
Question 195 of 233
195. Question
195. You create a report in Microsoft Power BI Desktop that connects to a SQL Server Analysis Services (SSAS) cube hosted on your company’s on-premises network.
You plan to publish the report to the Power BI service.Requirement:
Ensure that users viewing the report in the Power BI service always see the latest data from the SSAS cube.What should you implement?
CorrectIncorrect -
Question 196 of 233
196. Question
196. You have five sales regions, each assigned to one salesperson.
An imported dataset uses dynamic row-level security (RLS) with a role named Sales, which filters sales transactions by salesperson so that each user can only see data for their own region.
You publish the dataset to powerbi.com, configure the RLS role membership, and share the dataset and related reports with the sales team.Scenario:
One salesperson says she believes she should be able to see more data than is currently visible.
Requirement:
You need to verify exactly what data this salesperson can see.What should you do?
CorrectIncorrect -
Question 197 of 233
197. Question
197. You manage multiple Power BI dashboards.
Requirement:
When users browse dashboards in powerbi.com, they must be able to identify which dashboards contain Personally Identifiable Information (PII).Constraints:
Minimal configuration effort
No changes to dashboard layout or designWhat should you use?
CorrectIncorrect -
Question 198 of 233
198. Question
198. You manage a Power BI workspace that contains five reports and two dashboards.
Requirement:
Give all users in the organization read-only access to one dashboard and three specific reports.Proposed solution:
You create an Azure Active Directory (Azure AD) group that includes all users, and you share the selected reports and the dashboard with that group.Does this solution satisfy the requirement?
CorrectIncorrect -
Question 199 of 233
199. Question
199. You publish a dataset to the Power BI service. The dataset connects to an on-premises Microsoft SQL Server database.
When you try to set up a scheduled refresh, you can’t select the correct on-premises data gateway.You confirm the following with the gateway administrator:
You have the required permissions to use the gateway
The SQL Server data source has already been created on the gateway
The gateway status is RunningWhat is the most likely reason the gateway still can’t be selected?
CorrectIncorrect -
Question 200 of 233
200. Question
200. You have a Power BI dataset and a report that is connected to that dataset.
Requirement:
Allow users to analyze the data in Microsoft Excel, but only by connecting directly to the dataset (not by exporting data from the report).
You have already granted users the Build permission on the dataset.What should you do next?
CorrectIncorrect -
Question 201 of 233
201. Question
201. You have a Power BI workspace called BI Data that contains a dataset named BI Finance.
You have Build permission on the BI Finance dataset, but you do not have access to the BI Data workspace itself.
Requirement:
Connect to BI Finance and create a report.Which two actions can you perform to achieve this?
(Each correct answer represents a complete solution.)CorrectIncorrect -
Question 202 of 233
202. Question
202. You create a report in Microsoft Power BI Desktop that connects to a SQL Server Analysis Services (SSAS) tabular model hosted on your company’s on-premises network.
You plan to publish the report to the Power BI service.Requirement:
Ensure that users who view the report in the Power BI service always see the most up-to-date data from the tabular model.What should you implement?
CorrectIncorrect -
Question 203 of 233
203. Question
203. You have a Power BI semantic model named Model1 that contains sales data.
Requirement:
Ensure that Model1 refreshes on the first day of every month so it includes sales data from the previous month.What should you configure?
CorrectIncorrect -
Question 204 of 233
204. Question
204. You manage a Power BI workspace named Workspace1 and have a group called Group1.
Requirement:
Make sure members of Group1 receive notifications when there are issues or problems in Workspace1.Constraint:
The solution must follow the principle of least privilege.What should you do?
CorrectIncorrect -
Question 205 of 233
205. Question
205. You create a Power BI workspace called Workspace1 and publish a semantic model and a report to it.
You must configure access for a group named Sales with the following requirements:
Grant the group access to Workspace1
Allow the group to invite other users to the workspace
Apply the principle of least privilegeWhich workspace role should you assign to Sales?
CorrectIncorrect -
Question 206 of 233
206. Question
206. You are building a new semantic model in Microsoft Power BI Desktop.
When connecting to a previously used data source, you receive an error stating that the password has expired.
Requirement:
Update the credentials for the data source.What should you do?
CorrectIncorrect -
Question 207 of 233
207. Question
207. You open a PBIX file in Power BI Desktop that connects to a Microsoft Excel data source.
When you try to refresh the data, you receive the following error:
Expression.Error: The column ‘Cost’ of the table wasn’t found.What is a possible cause of this error?
CorrectIncorrect -
Question 208 of 233
208. Question
208. You manage a Power BI workspace named WS1 that contains:
A semantic model called SM1
Three reports (RPT1, RPT2, RPT3) that all use SM1
A dashboard (DB1) built from RPT1 and RPT2You need to give access to a group named Group1 while meeting all of the following requirements:
Group1 can view RPT1, RPT2, and DB1
Group1 cannot view RPT3
Group1 cannot create new reports or dashboards using SM1
Group1 cannot share reports or dashboards with others
Administrative effort must be minimizedWhat should you do?
CorrectIncorrect -
Question 209 of 233
209. Question
209. You have a Power BI report named Report1 that you want to share with multiple users.
To simplify access management, you decide to add the users to a group and share the report with that group instead of individual users.Which two types of groups can you use for this purpose?
(Each correct answer represents a complete solution.)CorrectIncorrect -
Question 210 of 233
210. Question
210. You are creating a Power BI report that connects to multiple data sources.
One of these data sources contains tax records, which are highly sensitive.
Requirement:
Ensure that other queries cannot access or combine data from the tax records source.What Privacy Level should you assign to the tax data source?
CorrectIncorrect -
Question 211 of 233
211. Question
211. You have a Power BI semantic model named Model1.
Requirement:
Allow users to confirm that the data in Model1 complies with corporate quality and governance standards.What should you do?
CorrectIncorrect -
Question 212 of 233
212. Question
212. You try to open a PBIX file in Microsoft Power BI Desktop.
While loading data in Power Query Editor, you receive the following error message:
DataSource.Error: Could not find file D:\Data.txtWhat should you do to fix the issue?
CorrectIncorrect -
Question 213 of 233
213. Question
213. You have a Microsoft Fabric workspace named Workspace1 that contains two Power BI reports: Report1 and Report2.
You publish a workspace app that includes both reports.You must configure the app so that:
Report1 is visible to all users in the organization
Report2 is visible only to a security group named Group1What should you do next?
CorrectIncorrect -
Question 214 of 233
214. Question
214. You have a PBIX file that contains sensitive data.
You must secure the file to meet these requirements:
If the PBIX file is shared via email, only internal users can open it.After the file is published to the Power BI service, only internal users can open:
the semantic model, and
any report downloaded from the service.What should you do?
CorrectIncorrect -
Question 215 of 233
215. Question
215. You need to create a relationship required for an executive-facing visual in a Power BI report.
Before you can create this relationship, a prerequisite change must be made to the data model.What should you do first?
CorrectIncorrect -
Question 216 of 233
216. Question
216. You need to connect to tables in a Microsoft SQL Server database and retrieve data for use in Power BI.
Which option should you use to configure the connection?
CorrectIncorrect -
Question 217 of 233
217. Question
217. You need to create a relationship between a product list table and a revenue results table in a Power BI data model.
Requirement:
The relationship configuration must optimize performance and minimize the time required to render visuals.What relationship cardinality should you choose?
CorrectIncorrect -
Question 218 of 233
218. Question
218. You are creating balance sheet reports in Power BI.
You need a DAX measure that correctly returns the ending balance for each reporting period.Which DAX expression should you use?
CorrectIncorrect -
Question 219 of 233
219. Question
219. You need to create table relationships in a Power BI data model to satisfy the reporting requirements of the customer service department.
What should you create?
CorrectIncorrect -
Question 220 of 233
220. Question
220. You need to implement a solution that grants sales managers access to only the data relevant to them.
What should you include in the solution?
CorrectIncorrect -
Question 221 of 233
221. Question
221. You combine data from the Sales_Region, Region_Manager, Sales_Manager, and Manager tables into a single table named Region.
Requirement:
Meet the executives’ reporting needs, which require viewing data by management structure.What should you do next?
CorrectIncorrect -
Question 222 of 233
222. Question
222. You need to create a solution that meets the reporting requirements of the sales department.
Which DAX object should you create?
CorrectIncorrect -
Question 223 of 233
223. Question
223. You need to resolve data quality issues in the existing environment related to sales amounts, ensuring that calculations exclude invalid values.
What should you do?
CorrectIncorrect -
Question 224 of 233
224. Question
224. You need to create a calculated column that displays the month and year based on the reporting requirements.
Which DAX expression should you use?
CorrectIncorrect -
Question 225 of 233
225. Question
225. You need to reduce the size of a Power BI dataset while still meeting all reporting requirements.
Which action should you take?
CorrectIncorrect -
Question 226 of 233
226. Question
226. You need to design a Power BI data model that satisfies the reporting requirements, including analysis by different date contexts.
What should you do in Power BI Desktop?
CorrectIncorrect -
Question 227 of 233
227. Question
227. You need to update a Power BI data model so that analysts can easily drill down in a visual from Business Unit to Product.
What should you create?
CorrectIncorrect -
Question 228 of 233
228. Question
228. You need to build an On-Time Shipping report.
The report must include a visualization that clearly shows the percentage of late orders.Which type of visualization should you use?
CorrectIncorrect -
Question 229 of 233
229. Question
229. You need to create a solution that satisfies the reporting requirements of the sales department, ensuring that calculations exclude invalid or negative sales values.
What should you create?
CorrectIncorrect -
Question 230 of 233
230. Question
230. You need to make sure that the report data stays up to date and continues to meet the reporting requirements.
Constraint:
The solution must require minimal configuration and maintenance effort.What should you do?
CorrectIncorrect -
Question 231 of 233
231. Question
231. You need to determine the minimum number of Power BI datasets required to support the reporting solution described in the scenario.
Which option meets the requirement?
CorrectIncorrect -
Question 232 of 233
232. Question
232. You need to create a Power BI dataset to meet the requirements described in the scenario.
Which dataset mode should you use?
CorrectIncorrect -
Question 233 of 233
233. Question
233. You need to configure secure access for sales department users to Power BI content.
Requirement:
The solution must meet security requirements and follow best practices for controlled distribution.What should you do?
CorrectIncorrect